Foot Pressure Analysis for Pedography and Gait Assessment
Source:vignettes/foot-pressure-analysis.Rmd
foot-pressure-analysis.Rmd



Plantar-pressure measurement is used in pedography, gait analysis, and diabetic-foot risk assessment. This vignette demonstrates the workflow using a synthetic in-shoe insole trial.
trial <- pr_example_trial("insole")
trial
#>
#> ── pr_trial ────────────────────────────────────────────────────────────────────
#> • System: "insole"
#> • Layout: "insole_standard"
#> • Frames: 250
#> • Duration: 4.98 s
#> • Sampling: 50 Hz
#> • Sensors: 99
#> • Subject: "EX01"
#> • Date: "2026-11-22"
#> • Condition: "walking"
Gait cycle detection
cycles <- pr_calc_gait_cycles(trial)
cycles
#> # A tibble: 5 × 8
#>   cycle heel_strike_frame toe_off_frame heel_strike_time toe_off_time
#>   <int>             <int>         <int>            <dbl>        <dbl>
#> 1     1                 1            31                0         0.6
#> 2     2                51            80                1         1.58
#> 3     3               101           130                2         2.58
#> 4     4               151           180                3         3.58
#> 5     5               201           231                4         4.6
#> # ℹ 3 more variables: stance_duration <dbl>, start_frame <int>, end_frame <int>


Regional analysis
pr_calc_regional(trial)
#> # A tibble: 7 × 6
#>   region           mpp   mvp max_force contact_area pti_mean
#>   <chr>          <dbl> <dbl>     <dbl>        <dbl>    <dbl>
#> 1 heel            219.  15.0     349.          42       40.3
#> 2 midfoot         643.  59.5    1234.          61.5    155.
#> 3 metatarsal_1    127.  23.0      41.7          6       65.1
#> 4 metatarsal_2_3  215.  43.0     113.           9      126.
#> 5 metatarsal_4_5  135.  16.0      48.5          9       43.9
#> 6 hallux          258.  29.4     118.           6       82.5
#> 7 lesser_toes     190.  12.7      71.8         12       29.6
Plantar-pressure reference observations
These source-specific observations are not universal clinical cut-offs. The synthetic insole example does not establish equivalent acquisition or patient context. Rows marked withdrawn have no verified numeric value.
pr_ref_diabetic_foot()
#> # A tibble: 4 × 11
#>   region      parameter threshold unit  interpretation  source source_url status
#>   <chr>       <chr>         <dbl> <chr> <chr>           <chr>  <chr>      <chr>
#> 1 forefoot    mpp             700 kPa   Case-control R… Armst… https://p… verif…
#> 2 any plantar pti_mean         NA kPa*s Withdrawn: exa… Casel… NA         withd…
#> 3 forefoot    mpp              NA kPa   Withdrawn: exa… Veves… NA         withd…
#> 4 heel        mpp              NA kPa   Withdrawn: exa… Frykb… NA         withd…
#> # ℹ 3 more variables: species <chr>, gait <chr>, region_scheme <chr>
Composite foot report
pr_plot_foot_report() returns four component plots.
Display them separately here so labels and legends remain readable at
the article width. The HTML/PDF report from
pr_export_report(trial, path, template = "foot") uses these
same components.
panels <- pr_plot_foot_report(trial)
panels[[1]]
panels[[2]]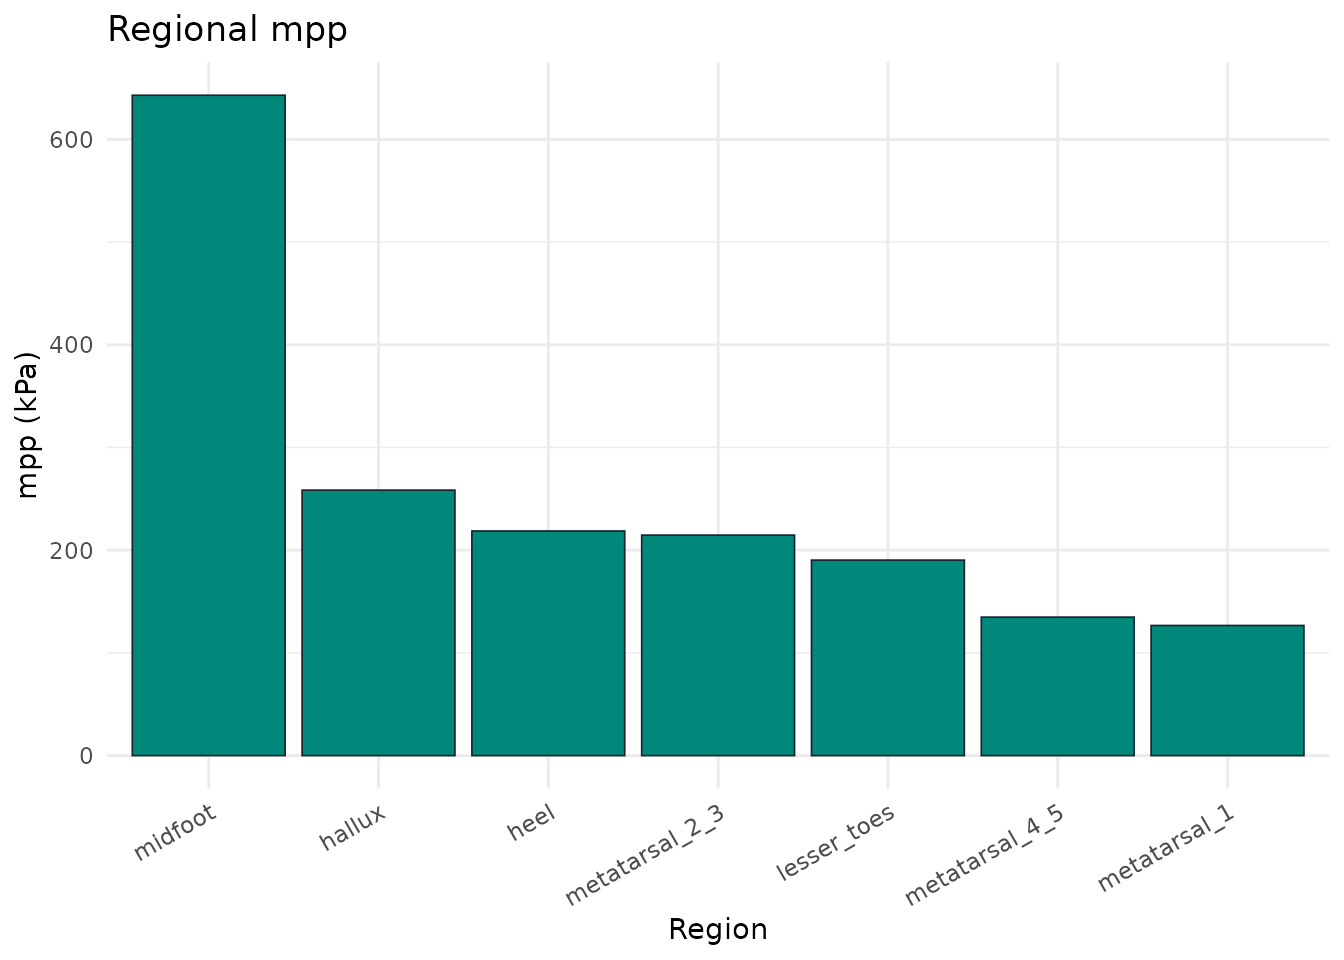
panels[[3]]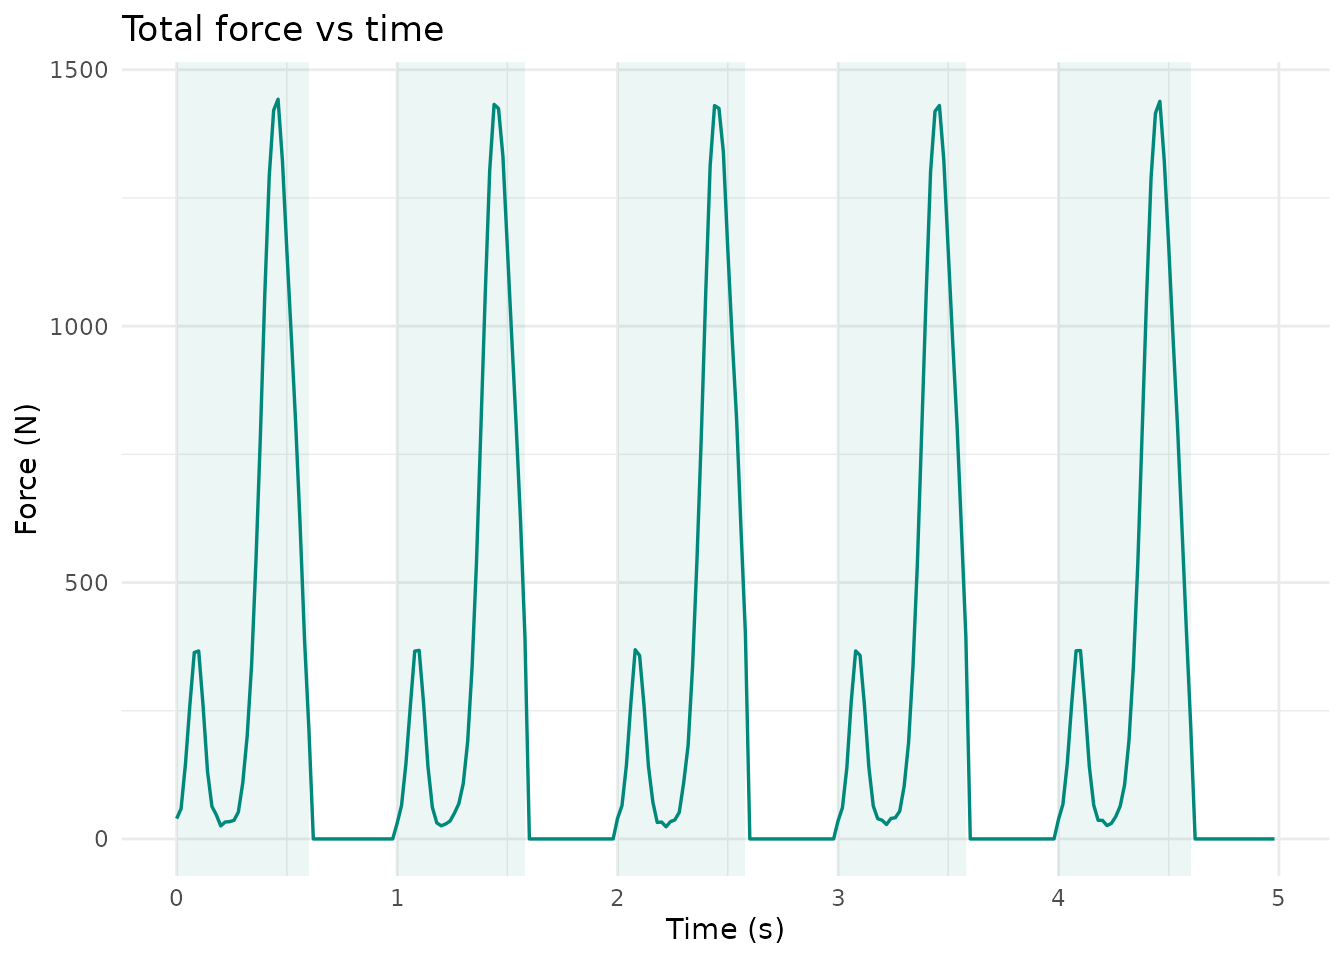
panels[[4]]