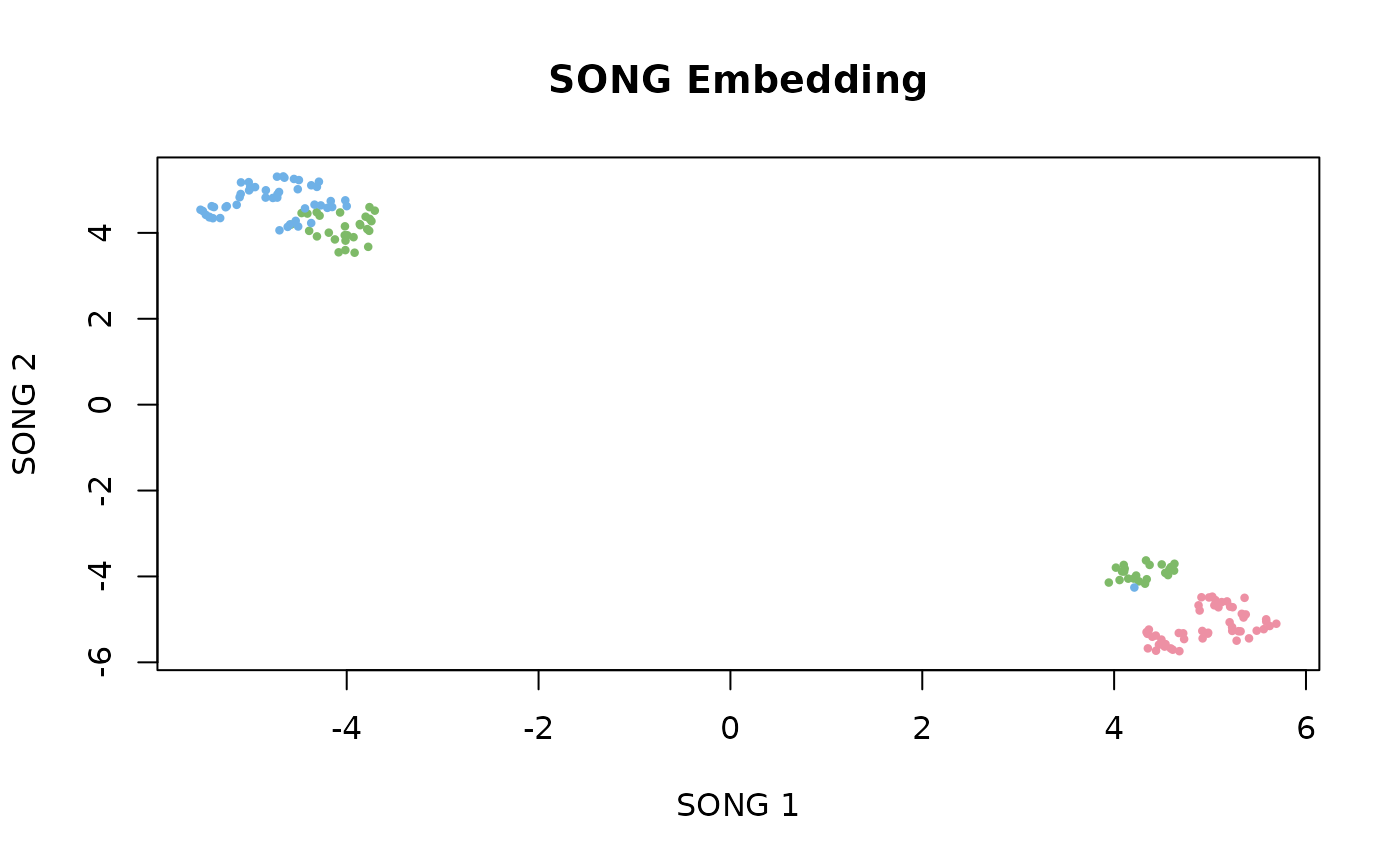
Visualize a "song_model" as a scatter plot of the embedding,
the codebook, or the codebook graph with edges.
Arguments
- x
A
"song_model"object.- type
Character. One of
"embedding"(all input points in embedding space),"codebook"(coding vectors only), or"graph"(coding vectors with edges drawn). Default:"embedding".- color_by
Optional vector (factor or numeric) of length equal to the number of input points (for
"embedding") or coding vectors (for"codebook"and"graph") used to color the points.- ...
Additional arguments passed to
plot.
References
Senanayake, D. A., Wang, W., Naik, S. H., & Halgamuge, S. (2021). Self-Organizing Nebulous Growths for Robust and Incremental Data Visualization. IEEE Transactions on Neural Networks and Learning Systems, 32(10), 4588–4602. doi:10.1109/TNNLS.2020.3023941
Examples
model <- song(as.matrix(iris[, 1:4]), epochs = 5L, seed = 42)
#> Epoch 1/5 | CVs: 3 | QE: 1.5296 | so_lr: 1.0000 | lr: 1.0000
#> Epoch 2/5 | CVs: 5 | QE: 0.8414 | so_lr: 0.8187 | lr: 0.8000
#> Epoch 3/5 | CVs: 9 | QE: 0.5442 | so_lr: 0.4493 | lr: 0.6000
#> Epoch 4/5 | CVs: 16 | QE: 0.4508 | so_lr: 0.1653 | lr: 0.4000
#> Epoch 5/5 | CVs: 25 | QE: 0.3978 | so_lr: 0.0408 | lr: 0.2000
#> Running UMAP dispersion step...
plot(model, color_by = iris$Species)