library(tidyverse)
set.seed(42)
theme_set(theme_minimal(base_size = 12))Week 2, Session 1 — MCAR, MAR, MNAR
Course 3 — #courses
Note
Inference lab using the five-step template: Hypothesis → Visualise → Assumptions → Conduct → Conclude.
Learning objectives
- Define MCAR, MAR, and MNAR and give an example of each.
- Simulate the three mechanisms and measure the bias in a complete-case analysis.
- Decide when a missingness assumption is defensible from the data alone and when it is not.
Prerequisites
Course 2 regression basics.
Background
The language of missingness is Rubin’s taxonomy. MCAR (missing completely at random) means the probability of being missing does not depend on anything — observed or unobserved. MAR (missing at random) means the probability depends only on observed variables. MNAR (missing not at random) means the probability depends on the missing value itself, even after conditioning on everything observed. Each is a property of the process, not the data, and you can rarely decide between MAR and MNAR from the data alone.
Complete-case analysis drops rows with missing values. For the unadjusted marginal mean in this example, MCAR gives unbiased estimation in repeated sampling. Under MAR, validity depends on the estimand and model: a correctly specified outcome regression can remain valid when missingness depends only on observed predictors. MNAR requires additional identifying assumptions and sensitivity analysis. Multiple imputation under MAR also needs a correctly specified imputation model compatible with the analysis; it does not resolve MNAR automatically.
Auxiliary variables — things that correlate with both the outcome and the missingness but are not in the analysis model — are the currency of MAR. If you have them, put them in the imputation model. If you do not, your MAR claim is on thinner ice than it appears.
Setup
1. Hypothesis
We estimate the mean of Y from each of three datasets with the same true mean, where Y has been made missing by MCAR, MAR, and MNAR processes.
2. Visualise
n  <- 1000
df <- tibble(
  x = rnorm(n, 50, 10),
  y = 2 + 0.5 * x + rnorm(n, 0, 5)
)

mcar <- df |> mutate(y_obs = if_else(runif(n) < 0.30, NA_real_, y),
                     mech  = "MCAR")
mar  <- df |> mutate(p = plogis(-2 + 0.05 * (x - 50)),
                     y_obs = if_else(runif(n) < p, NA_real_, y),
                     mech  = "MAR")
mnar <- df |> mutate(p = plogis(-2 + 0.05 * (y - mean(y))),
                     y_obs = if_else(runif(n) < p, NA_real_, y),
                     mech  = "MNAR")

all <- bind_rows(
  mcar |> select(mech, x, y, y_obs),
  mar  |> select(mech, x, y, y_obs),
  mnar |> select(mech, x, y, y_obs)
)

all |>
  mutate(missing = is.na(y_obs)) |>
  ggplot(aes(x, y, colour = missing)) +
  geom_point(alpha = 0.5) +
  facet_wrap(~ mech) +
  labs(colour = "Y missing?")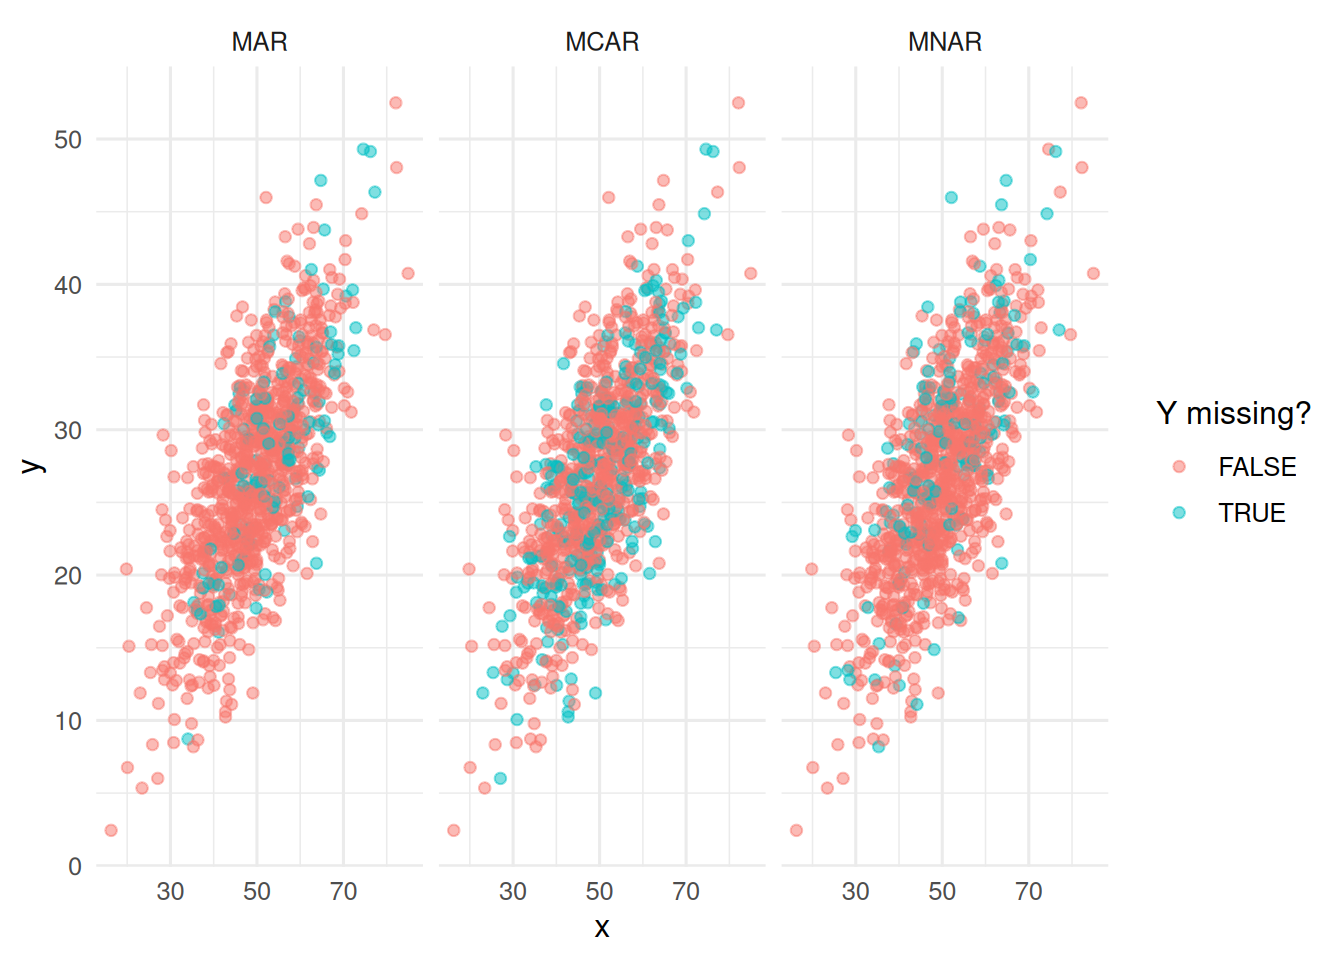
3. Assumptions
Complete-case analysis is the bluntest possible method. It is justified if missingness is MCAR. We will compute the mean of Y on observed rows for each mechanism and compare with the true mean.
4. Conduct
results <- all |>
  group_by(mech) |>
  summarise(
    truth = mean(y),
    cc    = mean(y_obs, na.rm = TRUE),
    bias  = cc - truth,
    pct_missing = mean(is.na(y_obs)) * 100
  )
results
# A tibble: 3 × 5
mech truth cc bias pct_missing
<chr> <dbl> <dbl> <dbl> <dbl>
1 MAR 26.8 26.5 -0.301 12.7
2 MCAR 26.8 27.0 0.135 28.5
3 MNAR 26.8 26.5 -0.380 14.9results |>
ggplot(aes(mech, bias)) +
geom_col(alpha = 0.7, fill = "steelblue") +
geom_hline(yintercept = 0, linetype = "dashed") +
labs(x = NULL, y = "Bias of complete-case mean")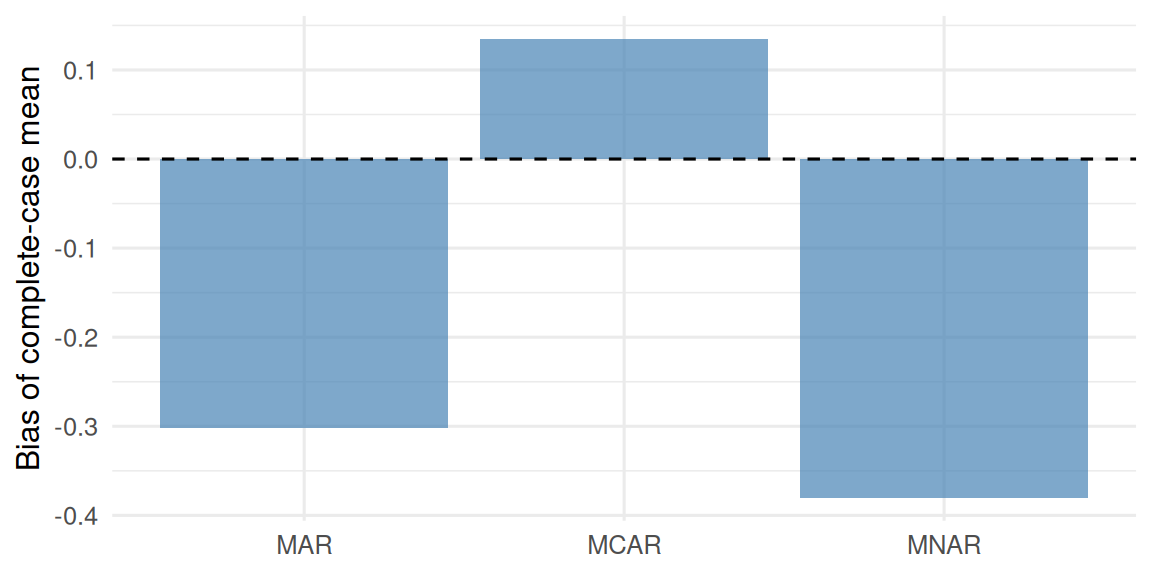
5. Concluding statement
In this single simulation, complete-case minus full-data mean was 0.13 under MCAR, -0.3 under MAR, and -0.38 under MNAR. These are observed differences in one sample, not repeated-simulation estimates of bias. The missingness fractions also differ by mechanism.
To estimate bias, repeat the simulation and average the estimation error against the known population mean. The companion app provides repeated draws.
Students often ask how to test for MCAR. Little’s test exists but can only reject MCAR; it cannot prove it. The assumption ultimately rests on argument, not on a p-value.
Common pitfalls
- Using Little’s test as evidence for MCAR.
- Imputing with a model that omits the analysis outcome.
- Reporting a sample size inflated by a complete-case filter that hides 40% dropout.
- Using “the missingness was not significantly related to X” as proof of MAR.
Further reading
- Little RJA, Rubin DB. Statistical Analysis with Missing Data.
- van Buuren S (2018), Flexible Imputation of Missing Data.
- Sterne JA et al. (2009), Multiple imputation for missing data in epidemiological and clinical research.
Session info
sessionInfo()R version 4.6.1 (2026-06-24)
Platform: x86_64-pc-linux-gnu
Running under: Ubuntu 26.04.1 LTS
Matrix products: default
BLAS: /usr/lib/x86_64-linux-gnu/openblas-pthread/libblas.so.3
LAPACK: /usr/lib/x86_64-linux-gnu/openblas-pthread/libopenblasp-r0.3.32.so; LAPACK version 3.12.0
locale:
[1] LC_CTYPE=C.UTF-8 LC_NUMERIC=C LC_TIME=C.UTF-8
[4] LC_COLLATE=C.UTF-8 LC_MONETARY=C.UTF-8 LC_MESSAGES=C.UTF-8
[7] LC_PAPER=C.UTF-8 LC_NAME=C LC_ADDRESS=C
[10] LC_TELEPHONE=C LC_MEASUREMENT=C.UTF-8 LC_IDENTIFICATION=C
time zone: UTC
tzcode source: system (glibc)
attached base packages:
[1] stats graphics grDevices datasets utils methods base
other attached packages:
[1] lubridate_1.9.5 forcats_1.0.1 stringr_1.6.0 dplyr_1.2.1
[5] purrr_1.2.2 readr_2.2.0 tidyr_1.3.2 tibble_3.3.1
[9] ggplot2_4.0.3 tidyverse_2.0.0
loaded via a namespace (and not attached):
[1] gtable_0.3.6 jsonlite_2.0.0 compiler_4.6.1 renv_1.3.1
[5] tidyselect_1.2.1 scales_1.4.0 yaml_2.3.12 fastmap_1.2.0
[9] R6_2.6.1 labeling_0.4.3 generics_0.1.4 knitr_1.52
[13] htmlwidgets_1.6.4 tzdb_0.5.0 pillar_1.11.1 RColorBrewer_1.1-3
[17] rlang_1.3.0 utf8_1.2.6 stringi_1.8.9 xfun_0.62
[21] S7_0.2.2 otel_0.2.0 timechange_0.4.0 cli_3.6.6
[25] withr_3.0.3 magrittr_2.0.5 digest_0.6.39 grid_4.6.1
[29] hms_1.1.4 lifecycle_1.0.5 vctrs_0.7.3 evaluate_1.0.5
[33] glue_1.8.1 farver_2.1.2 rmarkdown_2.32 tools_4.6.1
[37] pkgconfig_2.0.3 htmltools_0.5.9