library(tidyverse)
library(pROC)
library(MASS)
set.seed(42)
theme_set(theme_minimal(base_size = 12))Week 3, Session 3 — Biomarker statistics (Youden, NRI, decision curves)
Course 4 — #courses
Note
Testing labs use the main template: Hypothesis → Visualise → Assumptions → Conduct → Conclude.
Learning objectives
- Compute ROC-AUC, Youden’s index, sensitivity, and specificity at the optimal cut-point.
- Compute a net reclassification index between two predictive models.
- Construct a decision curve and interpret net benefit at a range of threshold probabilities.
Prerequisites
Binary classification and ROC curves from Course 1; logistic regression.
Background
A candidate biomarker is not useful until it is tied to a decision. ROC-AUC summarises discrimination across all thresholds but is insensitive to where on the curve the action happens. Youden’s index (sensitivity + specificity − 1) picks the threshold that maximises the equal-weighted sum. The net reclassification index (NRI) quantifies whether a new model reclassifies cases and non-cases in the correct direction relative to a baseline. Decision curve analysis plots net benefit as a function of the threshold probability, and lets a reader compare strategies (“treat all”, “treat none”, “treat by model”) across a clinically relevant range.
Discrimination, calibration, and net benefit are three complementary axes. A biomarker with high AUC that is poorly calibrated can produce harmful decisions; a perfectly calibrated biomarker with low AUC gives no useful ranking. Reporting all three keeps the evaluation honest.
Decision curves are not hypothesis tests. They are a principled way to put a clinical question — what is the harm-to-benefit ratio of acting on this prediction? — into the analysis, and to see how the answer depends on that ratio.
Setup
1. Hypothesis
Can a logistic model on Pima.tr (glucose, BMI, age) distinguish diabetic from non-diabetic patients well enough to support a screening decision?
2. Visualise
d <- as_tibble(MASS::Pima.tr)
ggplot(d, aes(glu, bmi, colour = type)) + geom_point(alpha = 0.7)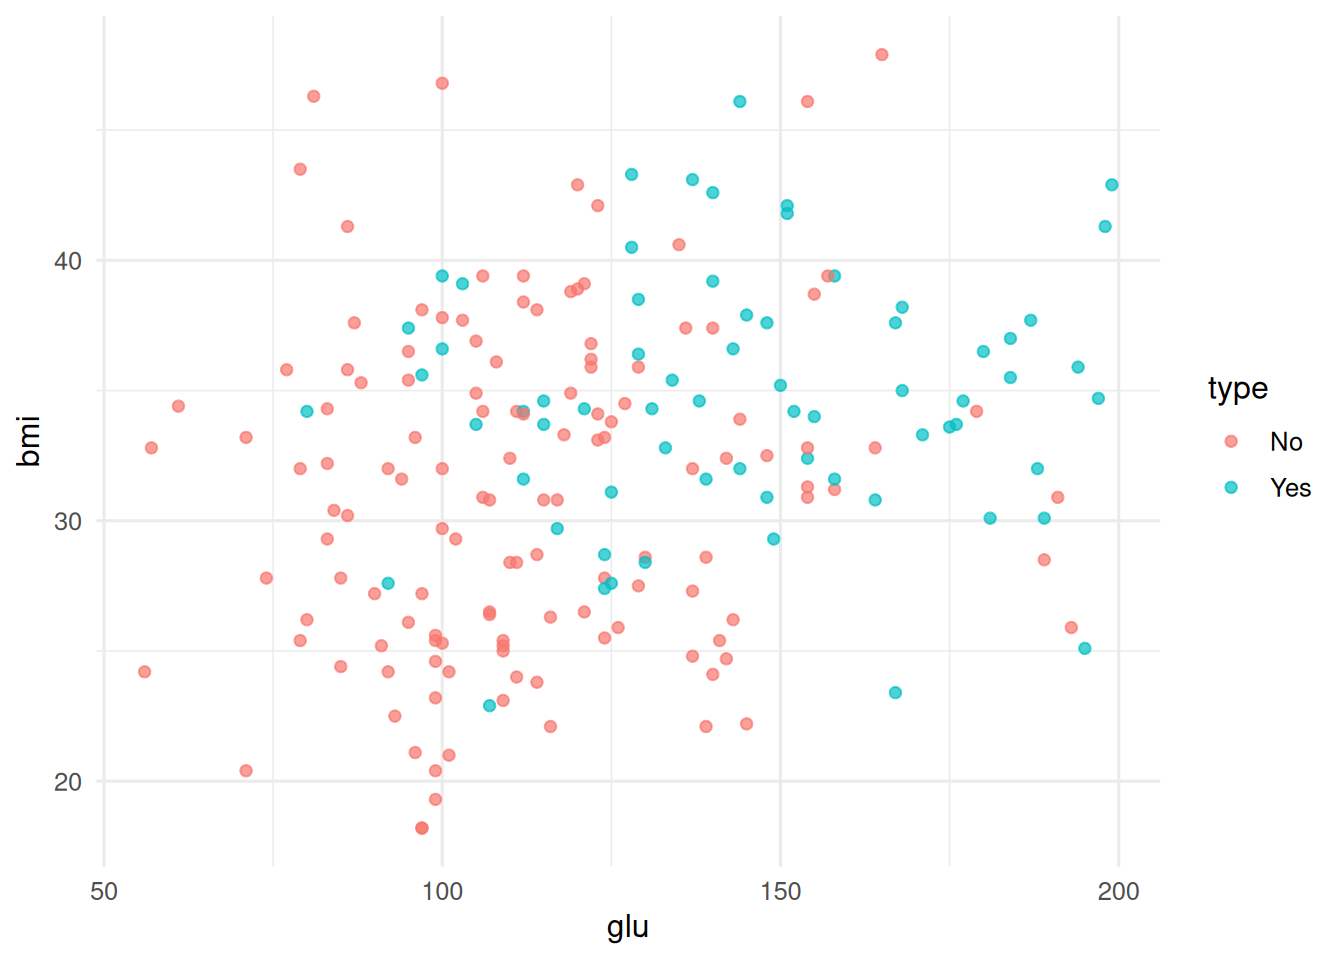
3. Assumptions
Independence of observations; probability of diabetes is monotone in the linear predictor; no missingness.
4. Conduct
Fit a simple logistic regression and compute discrimination.
fit <- glm(type ~ glu + bmi + age, data = d, family = binomial())
d$p <- predict(fit, type = "response")
r  <- roc(d$type, d$p, direction = "<", quiet = TRUE)
auc(r)
Area under the curve: 0.8355coords(r, "best", ret = c("threshold", "sensitivity", "specificity",
"youden"), transpose = FALSE) threshold sensitivity specificity youden
1 0.267804 0.8676471 0.6969697 1.564617NRI against a glucose-only baseline.
fit0 <- glm(type ~ glu, data = d, family = binomial())
p0 <- predict(fit0, type = "response")
p1 <- d$p
# Continuous NRI
case   <- d$type == "Yes"
nri_up <- mean(p1[case]  > p0[case])   - mean(p1[case]  < p0[case])
nri_dn <- mean(p1[!case] < p0[!case])  - mean(p1[!case] > p0[!case])
nri <- nri_up + nri_dn
c(nri_cases = nri_up, nri_noncases = nri_dn, nri_total = nri)
nri_cases nri_noncases nri_total
0.2941176 0.2878788 0.5819964 A manual decision curve.
thr <- seq(0.05, 0.6, by = 0.02)
dca <- sapply(thr, function(t) {
  treat <- p1 > t
  tp <- sum(treat &  case); fp <- sum(treat & !case); N <- length(case)
  tp / N - (fp / N) * (t / (1 - t))
})
nb_all <- sapply(thr, function(t) {
  tp <- sum(case); fp <- sum(!case); N <- length(case)
  tp / N - (fp / N) * (t / (1 - t))
})
tibble(threshold = thr, model = dca, treat_all = nb_all, treat_none = 0) |>
  pivot_longer(-threshold) |>
  ggplot(aes(threshold, value, colour = name)) + geom_line() +
  labs(x = "threshold probability", y = "net benefit")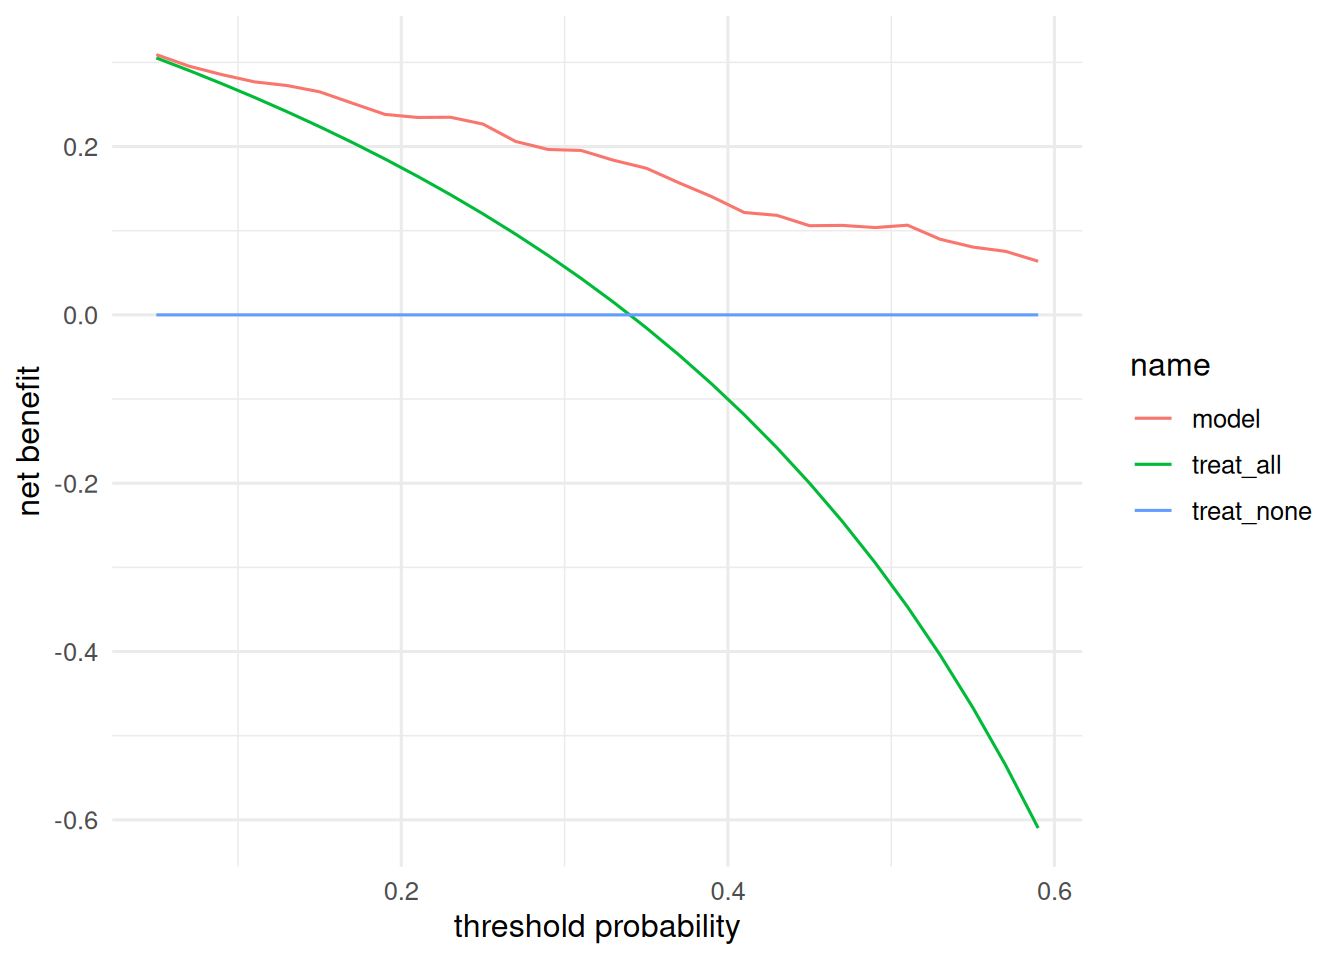
5. Concluding statement
A logistic model using glucose, BMI, and age discriminated diabetic from non-diabetic patients in
MASS::Pima.trwith AUC 0.835. The Youden-optimal cut-point occurred at a predicted probability of 0.27. Adding BMI and age to a glucose-only baseline produced an NRI of 0.58; the decision curve showed net benefit above “treat all” for threshold probabilities from roughly 0.15 to 0.5.
Decision curves give the clinical context: if the decision to intervene at, say, p = 0.2 is under discussion, the model is useful; at p = 0.05 or p = 0.7, it is barely distinguishable from treat-all or treat-none.
If time, show bootstrap CIs for AUC with pROC::ci.auc and for net benefit with resampling.
Common pitfalls
- Reporting AUC without calibration or decision curves.
- Computing NRI with a categorical risk cut-point and failing to disclose the cut-off.
- Using the same data to develop and evaluate the biomarker (apparent performance).
Further reading
- Pencina MJ, D’Agostino RB Sr, et al. (2008), Evaluating the added predictive ability of a new marker.
- Vickers AJ, Elkin EB (2006), Decision curve analysis.
Session info
sessionInfo()R version 4.5.2 (2025-10-31 ucrt)
Platform: x86_64-w64-mingw32/x64
Running under: Windows 11 x64 (build 26200)
Matrix products: default
LAPACK version 3.12.1
locale:
[1] LC_COLLATE=English_Germany.utf8 LC_CTYPE=English_Germany.utf8
[3] LC_MONETARY=English_Germany.utf8 LC_NUMERIC=C
[5] LC_TIME=English_Germany.utf8
time zone: Europe/Berlin
tzcode source: internal
attached base packages:
[1] stats graphics grDevices utils datasets methods base
other attached packages:
[1] MASS_7.3-65 pROC_1.19.0.1 lubridate_1.9.5 forcats_1.0.1
[5] stringr_1.6.0 dplyr_1.2.1 purrr_1.2.2 readr_2.2.0
[9] tidyr_1.3.2 tibble_3.3.1 ggplot2_4.0.3 tidyverse_2.0.0
loaded via a namespace (and not attached):
[1] gtable_0.3.6 jsonlite_2.0.0 compiler_4.5.2 Rcpp_1.1.1-1.1
[5] tidyselect_1.2.1 scales_1.4.0 yaml_2.3.12 fastmap_1.2.0
[9] R6_2.6.1 labeling_0.4.3 generics_0.1.4 knitr_1.51
[13] htmlwidgets_1.6.4 pillar_1.11.1 RColorBrewer_1.1-3 tzdb_0.5.0
[17] rlang_1.2.0 stringi_1.8.7 xfun_0.57 S7_0.2.2
[21] otel_0.2.0 timechange_0.4.0 cli_3.6.6 withr_3.0.2
[25] magrittr_2.0.4 digest_0.6.39 grid_4.5.2 hms_1.1.4
[29] lifecycle_1.0.5 vctrs_0.7.3 evaluate_1.0.5 glue_1.8.1
[33] farver_2.1.2 rmarkdown_2.31 tools_4.5.2 pkgconfig_2.0.3
[37] htmltools_0.5.9