Annotate ggplot with finalized inference
stat_inference.RdConstruct ordinary text and segment layers from stored results; no tests run during plot construction, build or drawing.
Usage
stat_inference(x, positions, rows = NULL,
  label = c("p", "estimate_ci", "estimate_ci_p", "stars"),
  p = c("reported", "raw", "adjusted"), groups = NULL, facet_vars = NULL,
  template = NULL, digits = 3L, p_digits = 3L, decimal_mark = ".",
  unavailable = c("label", "error", "warn"), tip_length = 0.03,
  label_offset = 0, text_size = 3.5, colour = "black", linewidth = 0.4,
  text_hjust = 0.5, text_vjust = -0.4)
annotate_inference(plot, x, positions, ...)
Arguments
- x
A finalized shared result.
- positions
Data.frame with exactly one row per selected row_id and a finite y_position in original data units. Brackets require numeric xmin/xmax or named group1/group2. Text-only annotations use numeric x. Optional type is bracket or text. Omnibus rows require text.
- rows
Unique stored row IDs, or NULL for all.
- label
Compact display preset.
- p
Stored p-value selection. Missing requested adjusted values are an error.
- groups
Distinct group labels in the plotted discrete-axis order when named endpoints are used. Supply updated levels after reordering the axis.
- facet_vars
Facet column names, which must exist and agree in both positions and stored result rows. Defaults to the result metadata's facet_vars contract, if present.
- template
Approved field substitution as in report_text.
- digits, p_digits, decimal_mark
Shared display precision and decimal mark.
Keep an explicit unavailable label, error, or warn and keep the label.
- tip_length, label_offset
Offsets in original y units. Choose positive-scale-compatible coordinates before applying a log scale.
- text_size, colour, linewidth
Text and segment appearance.
- text_hjust, text_vjust
Text justification. For a horizontal coord_flip path, use -0.1 and 0.5, respectively, and provide adequate scale expansion.
- plot
Existing ggplot object with Cartesian coordinates or coord_flip.
- ...
Arguments passed to stat_inference.
Value
stat_inference returns a list of ordinary ggplot layers with inherit.aes=FALSE, plus annotation_data and inference_metadata attributes. annotate_inference returns the plot with these layers.
Details
ggplot2 is optional for package loading and plain reporting. The function never extracts plotting observations or fits a test. Named group order controls only geometry, not the stored scientific contrast sign. Numeric endpoints support explicit dodge positions. Nonsignificant rows remain visible by default. Selection never changes an adjustment family.
Positions are supplied before scale transformations: y_position=100 becomes 2 under scale_y_log10 exactly once. Cartesian and coord_flip paths are supported. Polar and arbitrary nonlinear coordinates, automatic positioning, automatic dodge detection and automatic free-scale placement are not supported. annotate_inference rejects an existing unsupported coordinate system; later-added coordinates cannot be guarded by a list of layers.
For subgroup results, always supply facet_vars and matching keys; missing requested keys error instead of broadcasting. A layer cannot validate facets added later or infer that an undeclared column represents a subgroup. The caller must maintain that explicit contract.
Examples
if (requireNamespace("ggplot2", quietly = TRUE)) {
  x <- infercalcR::new_inference_result(
    data.frame(row_id = "a-b", p.value = 0.04, status = "ok"),
    list(method_id = "example"))
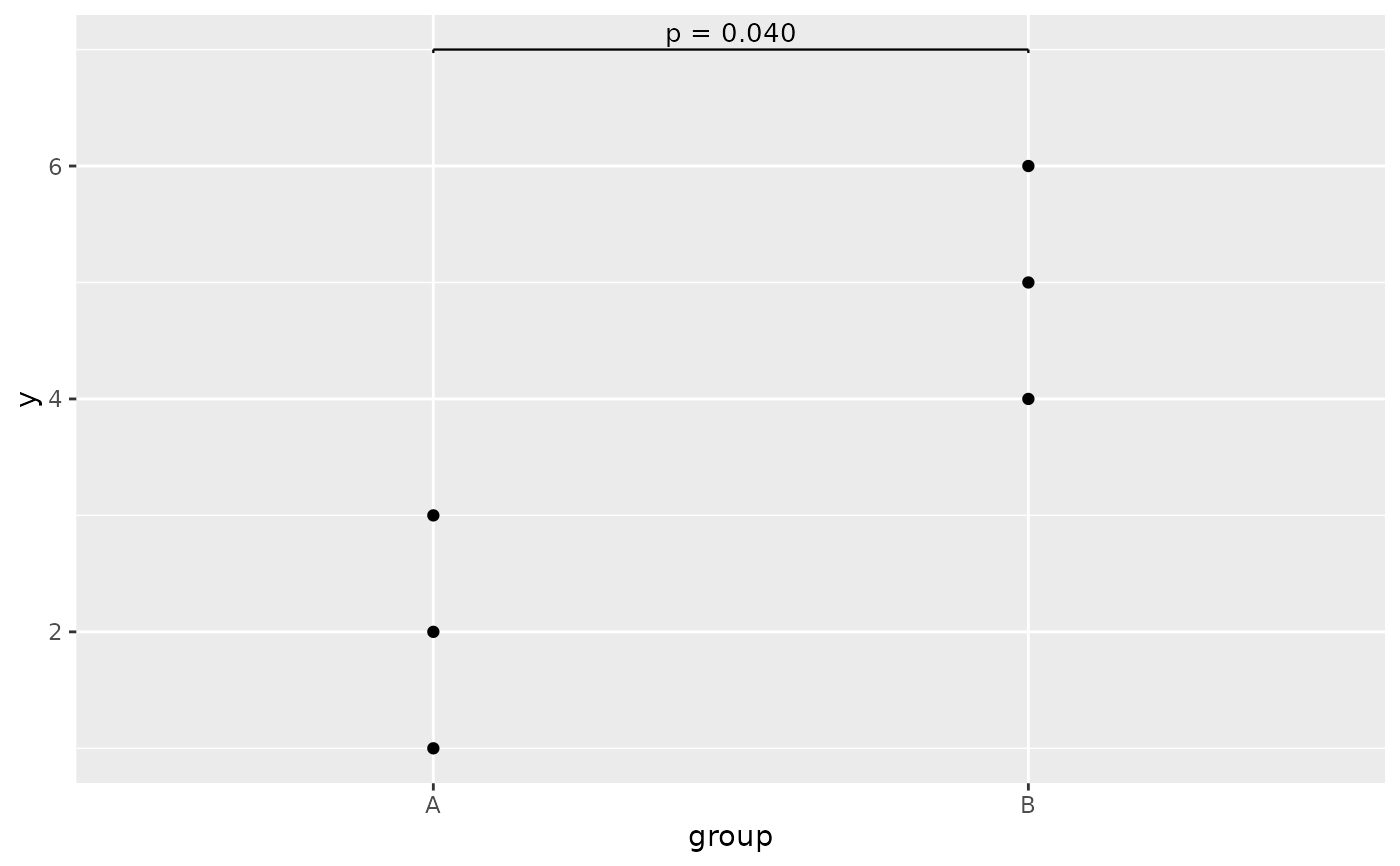
  d <- data.frame(group = rep(c("A", "B"), each = 3), y = 1:6)
  p <- ggplot2::ggplot(d, ggplot2::aes(group, y)) + ggplot2::geom_point()
  p + stat_inference(x, data.frame(row_id = "a-b", xmin = 1,
    xmax = 2, y_position = 7))
}