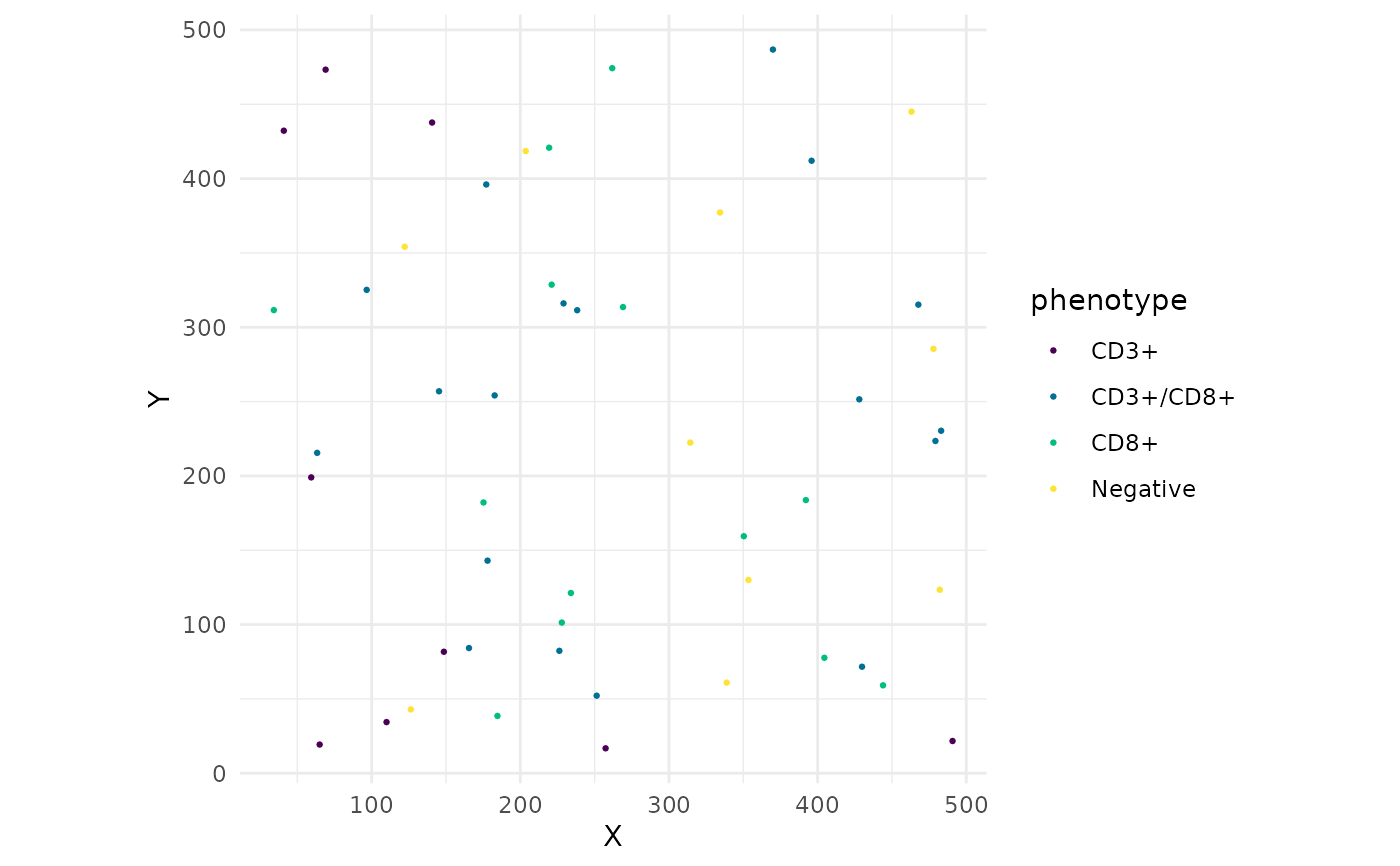
Scatter plot of cell positions coloured by phenotype, cluster, or any
metadata column. Analogous to Seurat's DimPlot but in tissue
space.
Usage
CellMap(
  object,
  colour_by = "phenotype",
  colours = NULL,
  pt_size = 0.5,
  title = NULL,
  dark_theme = FALSE
)
Arguments
- object
An
SpatialCellDataobject.- colour_by
Character. Column name in
meta_datato colour by. Default"phenotype".- colours
Named character vector or
NULLfor automatic colours via the global palette.- pt_size
Numeric. Point size. Default
0.5.- title
Character or
NULL. Plot title.- dark_theme
Logical. Use a dark background (useful for tissue images). Default
FALSE.
Examples
counts <- matrix(rnorm(100), nrow = 50,
                 dimnames = list(NULL, c("CD3", "CD8")))
coords <- data.frame(x = runif(50, 0, 500), y = runif(50, 0, 500))
obj <- CreateSpatialObject(counts, coords)
obj <- PhenotypeCells(obj, thresholds = list(CD3 = 0, CD8 = 0))
CellMap(obj)