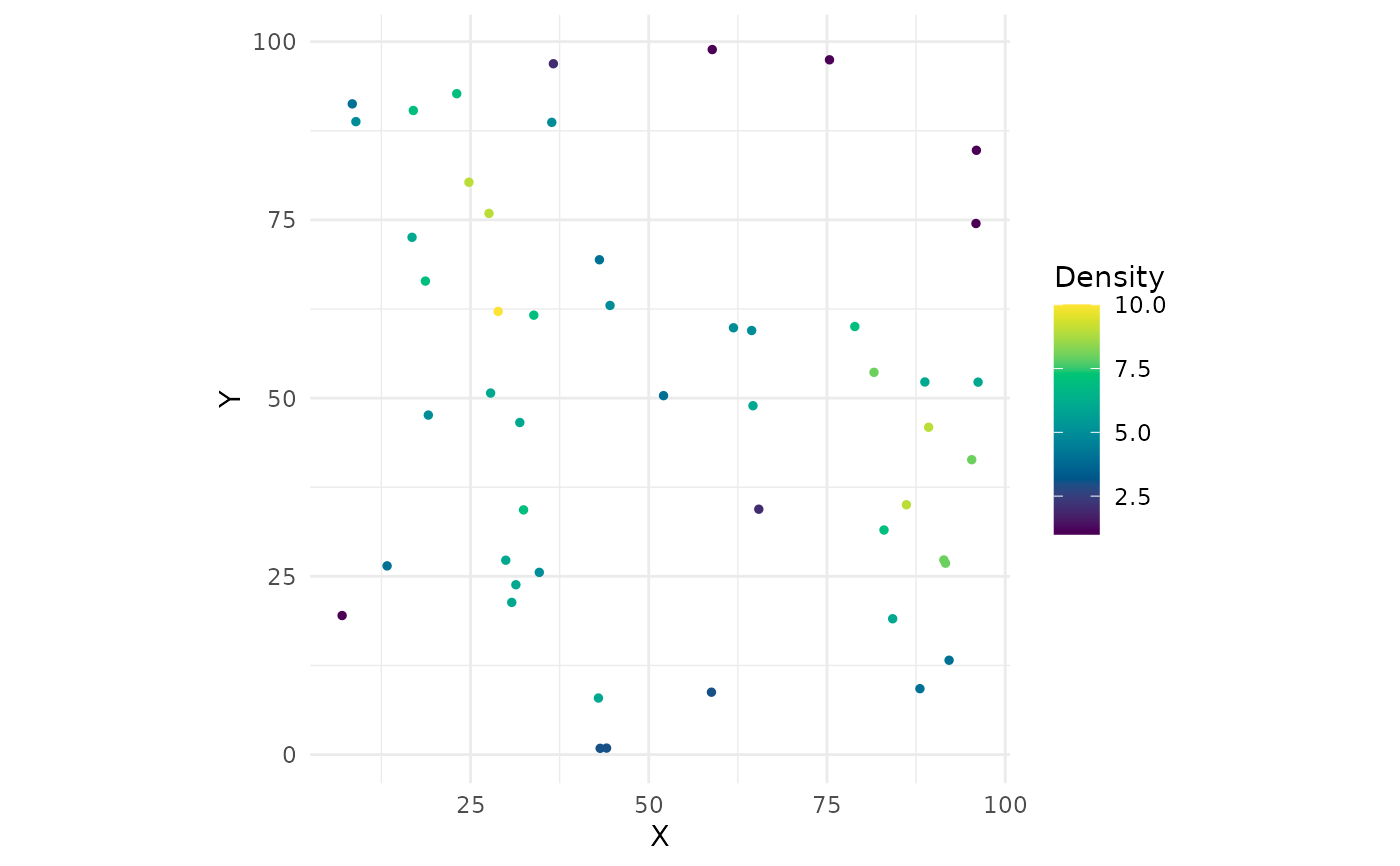
Scatter plot with colour scaled by local cell density. Requires
CellDensity to have been run.
Arguments
- object
An
SpatialCellDataobject with adensitycolumn.- pt_size
Numeric. Point size. Default
1.- title
Character or
NULL.- palette
Character or character vector. Default
NULL(global palette).
Examples
counts <- matrix(rnorm(100), nrow = 50,
                 dimnames = list(NULL, c("CD3", "CD8")))
coords <- data.frame(x = runif(50, 0, 100), y = runif(50, 0, 100))
obj <- CreateSpatialObject(counts, coords)
obj <- CellDensity(obj, radius = 20)
DensityPlot(obj)