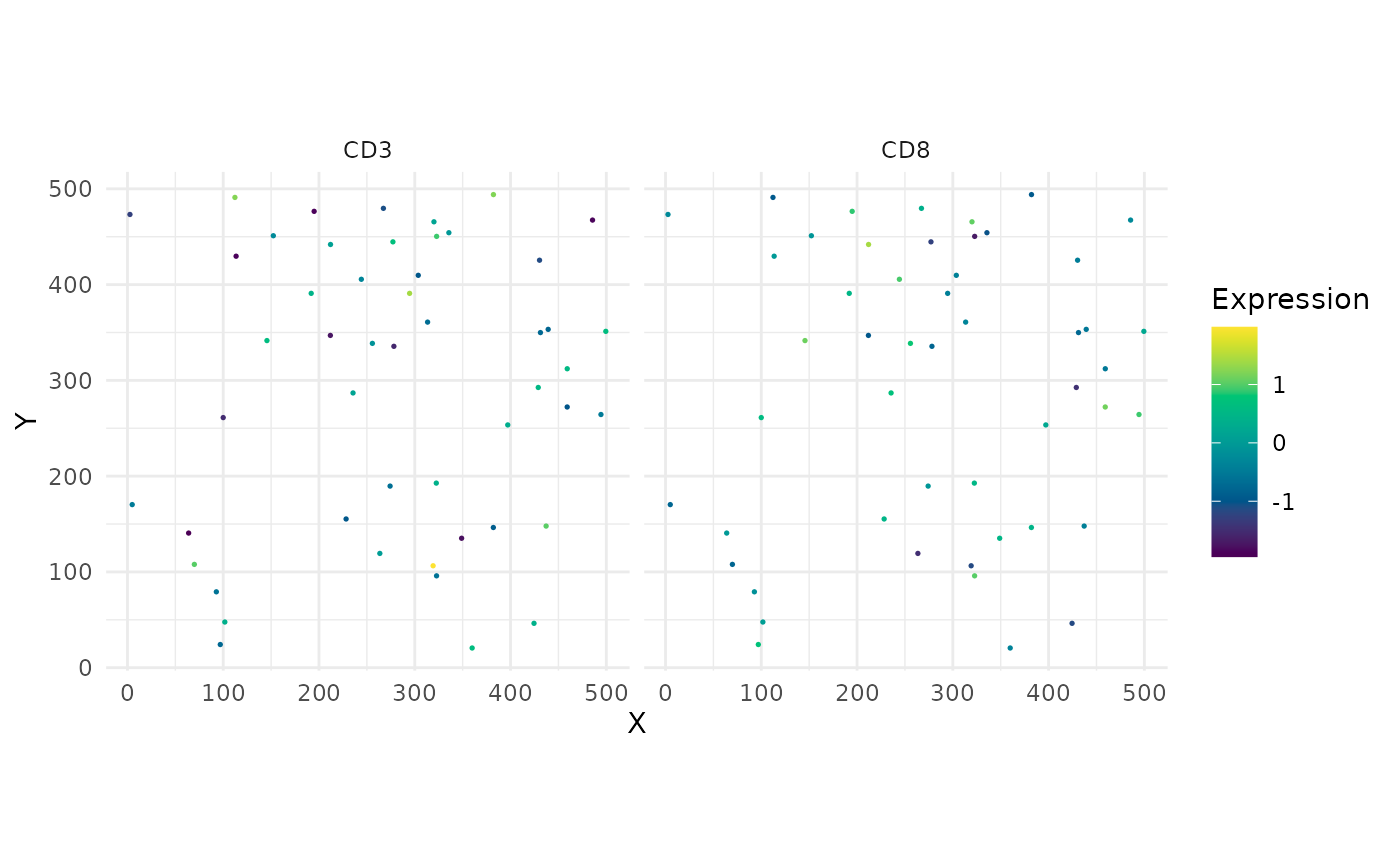
Plots marker expression intensity on spatial coordinates. Each marker
gets its own panel. Similar to Seurat's FeaturePlot but in
tissue space.
Usage
FeaturePlot(
  object,
  features,
  slot = "data",
  pt_size = 0.3,
  ncol = NULL,
  palette = NULL,
  dark_theme = FALSE
)
Arguments
- object
An
SpatialCellDataobject.- features
Character vector. Marker names to plot.
- slot
Character.
"data"or"counts".- pt_size
Numeric. Point size. Default
0.3.- ncol
Integer. Number of columns in the faceted layout. Default
NULL(auto).- palette
Character or character vector. Colour palette. Default
NULLuses the global palette.- dark_theme
Logical. Dark background. Default
FALSE.
Examples
counts <- matrix(rnorm(150), nrow = 50,
                 dimnames = list(NULL, c("CD3", "CD8", "PanCK")))
coords <- data.frame(x = runif(50, 0, 500), y = runif(50, 0, 500))
obj <- CreateSpatialObject(counts, coords)
FeaturePlot(obj, features = c("CD3", "CD8"))