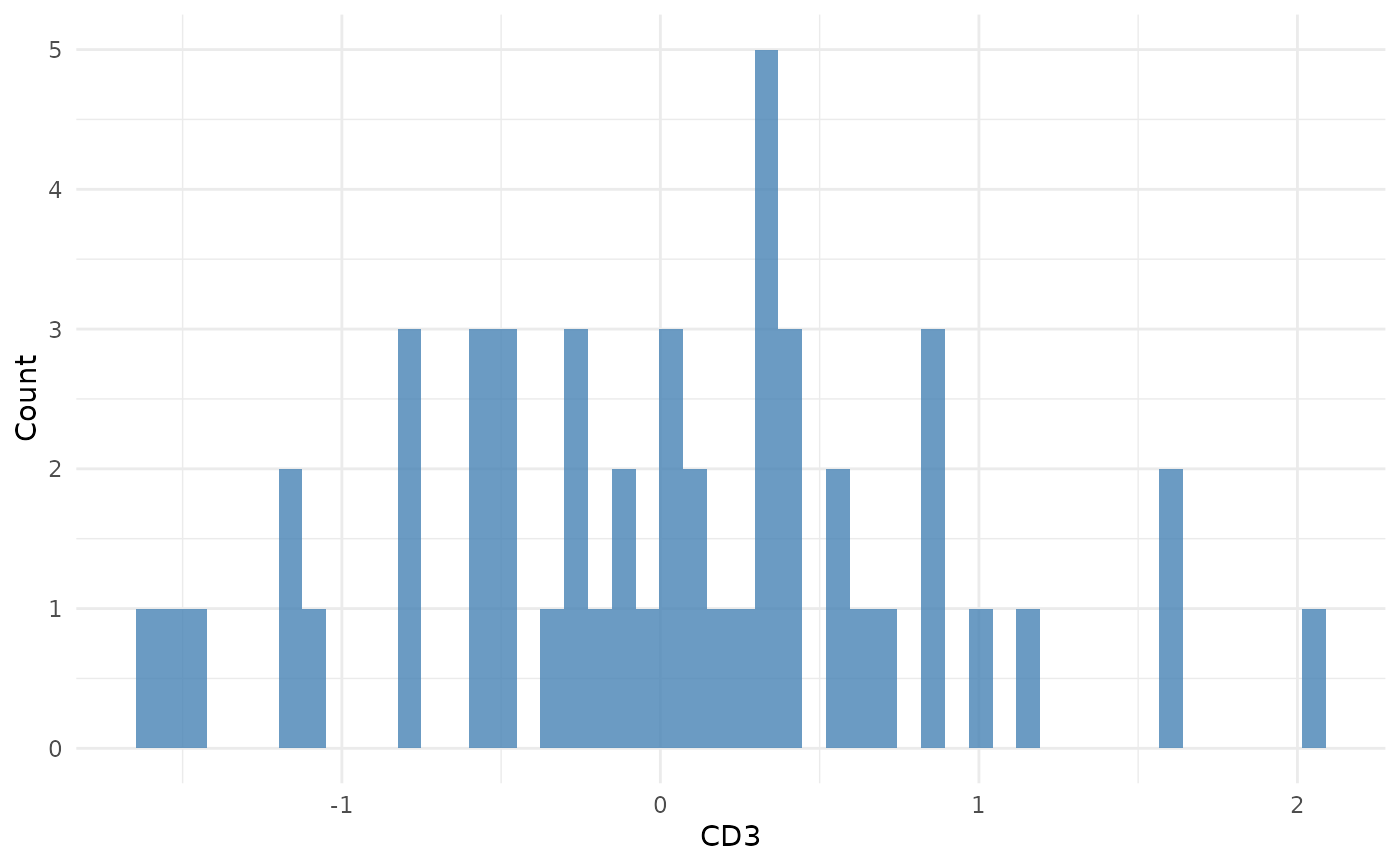
Histogram of Marker Expression
Arguments
- object
An
SpatialCellDataobject.- feature
Character. Single marker name.
- group_by
Character or
NULL. Metadata column for fill grouping.- slot
Character.
"data"or"counts".- bins
Integer. Number of bins. Default
50.- colours
Named character vector or
NULL.
Examples
counts <- matrix(rnorm(100), nrow = 50,
                 dimnames = list(NULL, c("CD3", "CD8")))
coords <- data.frame(x = runif(50), y = runif(50))
obj <- CreateSpatialObject(counts, coords)
HistogramPlot(obj, feature = "CD3")