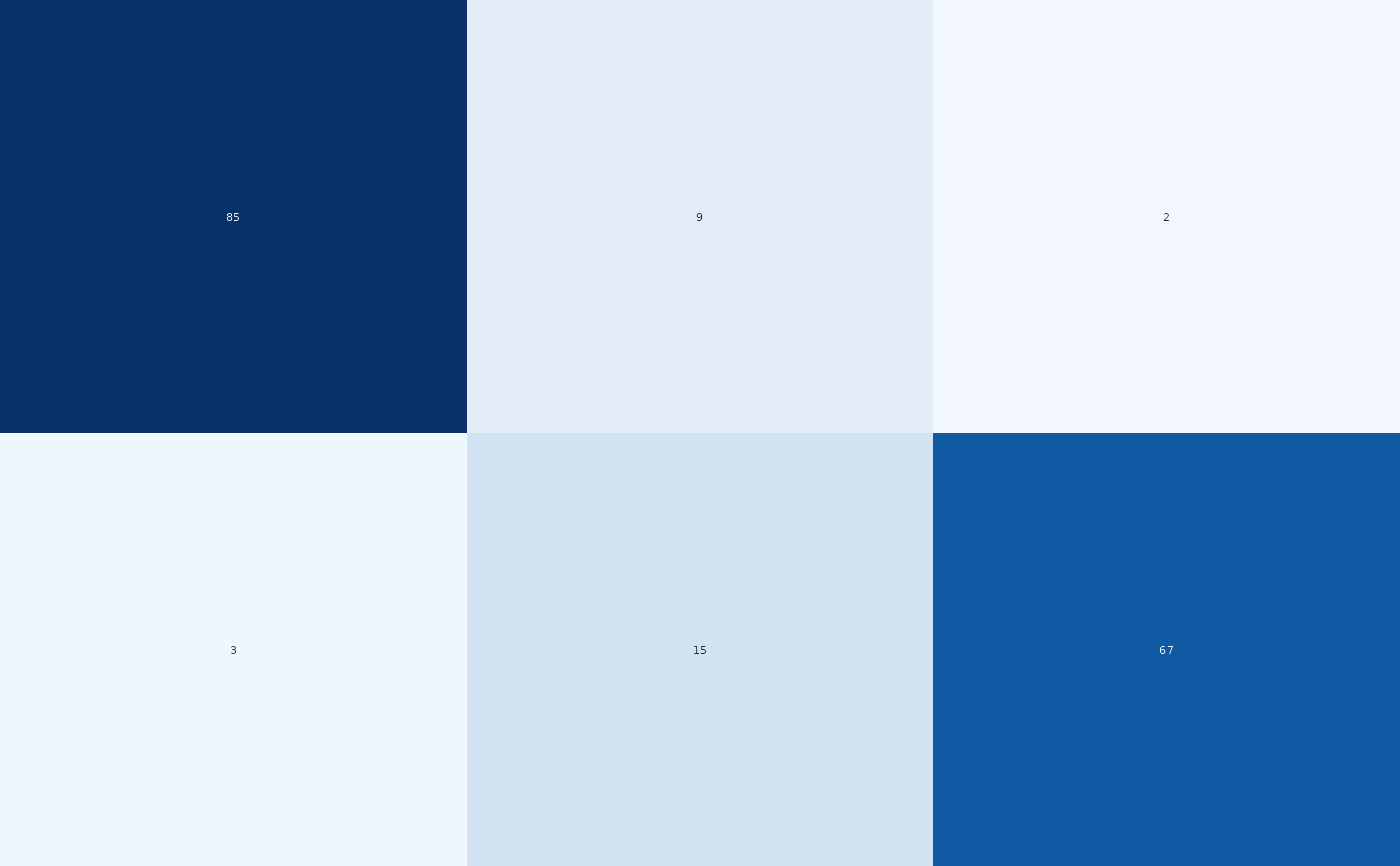
Draws a matrix of coloured cells, optionally with the values printed in
the cells, coloured annotation boxes left of the rows, coloured or boxed
column labels and a colour bar. Colours follow a 256-step ramp between
the anchors of a named scale ("blues", "rdbu_r", "rdbu", "greys") or
of given colours, as image heatmaps of common figure code; values can be
coloured on a log10(x + 1) scale while the printed numbers stay raw.
Usage
PlotAnnotatedHeatmap(
  data,
  row = "row",
  column = "column",
  value = "value",
  rows = NULL,
  columns = NULL,
  row_order_by = NULL,
  column_order_by = NULL,
  row_labels = NULL,
  column_labels = NULL,
  scale = "blues",
  limits = NULL,
  transform = c("identity", "log10p1"),
  fill_column = NULL,
  missing_colour = "#EEEEEE",
  drop_columns_below = NULL,
  cell_text = NULL,
  row_colours = NULL,
  row_box = c(-1.05, 0.4, 0.7),
  column_colours = NULL,
  column_fills = NULL,
  column_fill_alpha = 0.55,
  column_angle = 0,
  column_size = 5.1,
  column_pad = 3.5,
  row_size = 5.3,
  row_pad = 3.5,
  row_italic = FALSE,
  show_rows = TRUE,
  show_columns = TRUE,
  x_label = NULL,
  x_label_size = 5,
  x_label_pad = 2,
  colourbar = NULL,
  texts = NULL,
  values = NULL,
  style = ManuscriptStyle()
)
Arguments
- data
Long data: one row per matrix cell.
- row, column, value
Column names.
- rows, columns
Row order (top to bottom) and column order (left to right): character vectors or data frames (ordered by a
rankcolumn if present); default first appearance.- row_order_by, column_order_by
Optional numeric columns of
datagiving the row or column order.- row_labels, column_labels
Display labels: named mapping or vector.
- scale
Colour scale name or vector of anchor colours.
- limits
Colour limits (on the transformed scale); default the range.
- transform
"identity"or"log10p1"(colour bylog10(x + 1)).- fill_column
Optional column with explicit cell colours (overrides
scale).- missing_colour
Colour of missing cells.
- drop_columns_below
Drop columns whose largest value is below this.
- cell_text
Optional list printing values in cells:
min(smallest value printed),format("fixed"withdigits, or"count": thousands separator and"12k"fromabbreviateupwards),white_above(raw values above it are printed inlight_colour),size(points).- row_colours
Named colours of row annotation boxes.
- row_box
Box geometry
c(left, width, height)in column units, left measured from the centre of the first column.- column_colours
Named text colours of column labels.
- column_fills
Named colours of rounded boxes behind column labels.
- column_fill_alpha
Opacity of these boxes.
- column_angle, column_size, column_pad
Column label rotation (degrees), size and distance from the matrix (points).
- row_size, row_pad, row_italic
Row label size, distance and italics.
- show_rows, show_columns
Draw row or column labels.
- x_label, x_label_size, x_label_pad
Title below the column labels.
- colourbar
Optional list:
box(c(left, bottom, width, height)in panel fractions),title,breaks,labels,tick_size,title_size.- texts
Optional texts at panel fractions (list of
label,xy,size,colour,bold,hjust,vjust,angle); labels may useFormatTemplate()placeholders filled fromvalues.- values
Optional data frame for text templates.
- style
A
ManuscriptStyle()object.