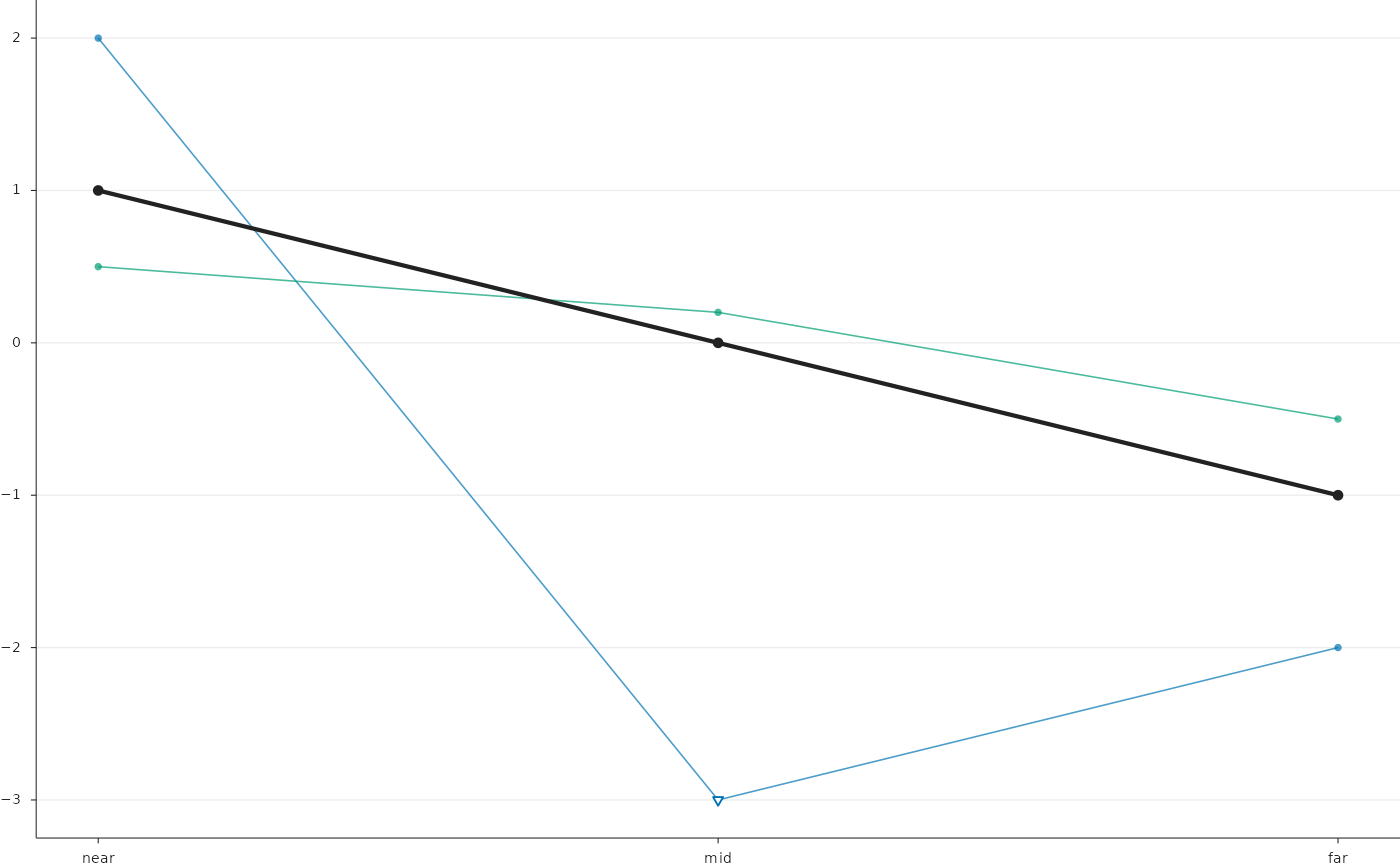
Two forms for values over ordered categories such as distance bands.
Without lower and upper: one thin line per unit (patient) coloured by
its group, a thick summary line of the medians, and values of -Inf
(for example the log ratio of an empty band) drawn as open triangles at
floor. With lower and upper: one summary line per series with
vertical interval segments, series side by side within each category.
Usage
PlotBandProfiles(
  data,
  x = "band",
  y = "value",
  series = "patient",
  group = "group",
  x_order = NULL,
  x_labels = NULL,
  group_colours = NULL,
  floor = NULL,
  floor_label = NULL,
  floor_size = 4.6,
  linewidth = 0.6,
  line_alpha = 0.7,
  marker_size = 1.8,
  summary = TRUE,
  summary_colour = "ink",
  summary_linewidth = 1.6,
  summary_marker = 3,
  lower = NULL,
  upper = NULL,
  series_order = NULL,
  colours = NULL,
  dodge = 0.12,
  interval_linewidth = 1,
  interval_alpha = 0.6,
  reference_y = NULL,
  y_limits = NULL,
  y_breaks = NULL,
  y_nbins = 9,
  x_label = NULL,
  y_label = NULL,
  tick_size = NULL,
  box_mm = NULL,
  style = ManuscriptStyle()
)
Arguments
- data
Tidy data: one row per unit (or series) and category.
- x
Category column.
- y
Value column.
- series
Unit (or series) column.
- group
Group column of the units (profile form).
- x_order
Category order;
x_labelstheir tick labels.- x_labels
Tick labels.
- group_colours
Named colours per group.
- floor
Value at which
-Infis drawn;floor_labelis written to the right of the last category at that height.- floor_label, floor_size
Text and size of the floor note.
- linewidth, line_alpha, marker_size
Unit lines (points; marker diameter as for line markers with a 1 pt edge).
- summary
Draw the median line (profile form).
- summary_colour, summary_linewidth, summary_marker
Median line style.
- lower, upper
Interval columns (summary form).
- series_order, colours
Series order and named colours (summary form).
- dodge
Offset between series within a category.
- interval_linewidth, interval_alpha
Interval segment style.
- reference_y
Optional horizontal reference line.
- y_limits, y_breaks, y_nbins
y axis (see
PlotQuantileCurves()).- x_label, y_label
Axis titles.
- tick_size
Tick label size.
- box_mm
Size of the data area
c(width, height)in millimetres, passed byRenderFigure(); used by"auto"tick intervals (seeNiceBreaks()).- style
A
ManuscriptStyle()object.
Examples
d <- data.frame(patient = rep(c("p1", "p2", "p3"), each = 3),
                group = rep(c("A", "B", "A"), each = 3),
                band = rep(c("near", "mid", "far"), 3),
                value = c(1, 0, -1, 2, -Inf, -2, 0.5, 0.2, -0.5))
PlotBandProfiles(d, x_order = c("near", "mid", "far"), floor = -3,
                 group_colours = c(A = "#009E73", B = "#0072B2"), floor_label = "none")