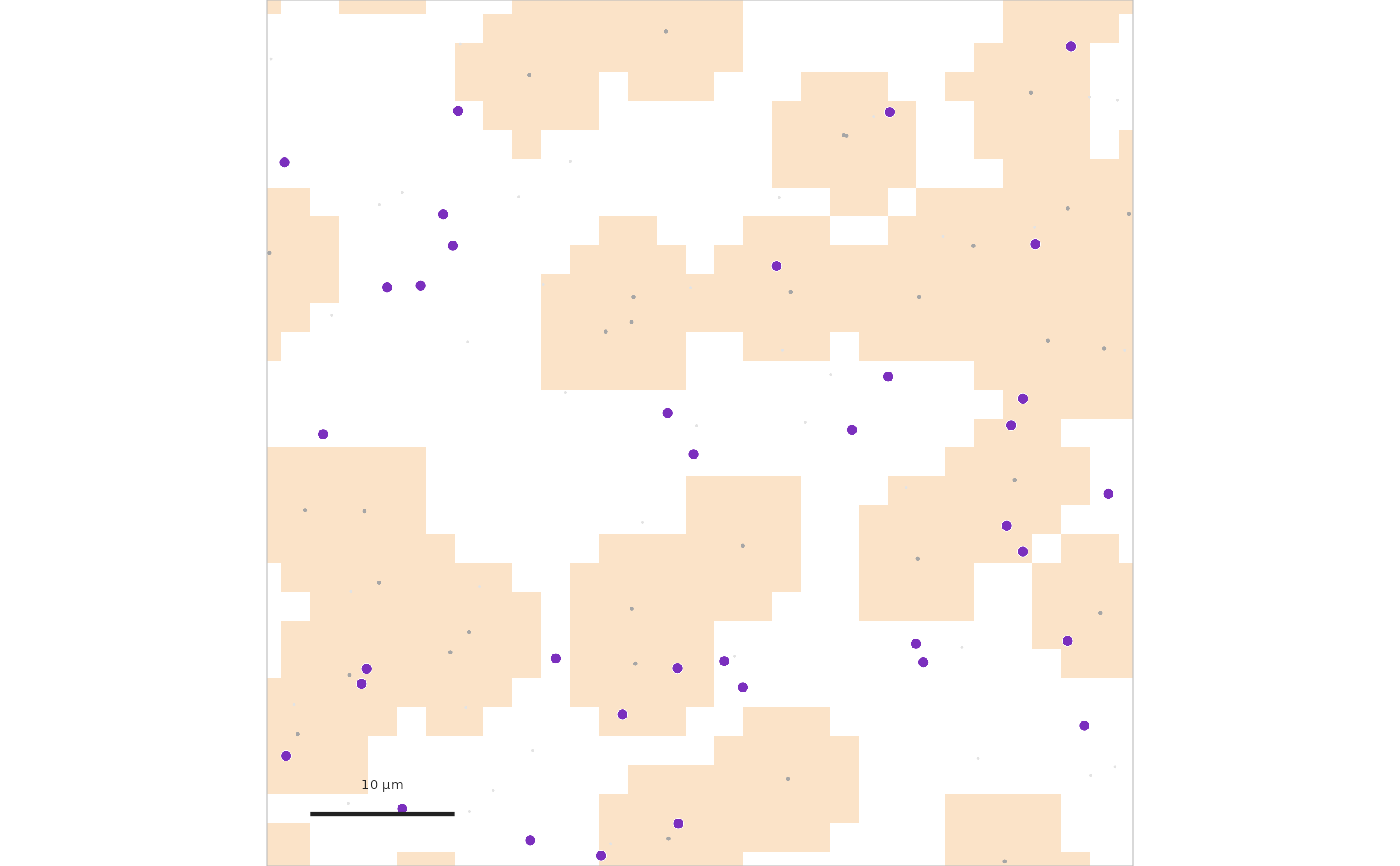
Draws cells as points in layers (by label or any column condition) on an
optional interface-zone tint, with frame, scale bar, field label, title
above the map and boxes. Point sizes follow the area convention of common
scatter plots (size is the marker area in square points); larger
markers get a thin edge. Without a field size the whole section is drawn
and the scale bar sits below the map.
Usage
PlotCellMap(
  data,
  layers = list(),
  rest = list(colour = "#E3E3E3", size = 1.2),
  exclusive = TRUE,
  point_extra = 0,
  title_align = "left",
  interface_colour = "subsets/interface",
  limits = NULL,
  expand = 0,
  scale_bar = NULL,
  frame = TRUE,
  frame_colour = "frame",
  frame_width = NULL,
  label = NULL,
  label_colour = "white",
  label_size = 5.5,
  title = NULL,
  subtitle = NULL,
  title_colour = "ink",
  title_size = 5.6,
  labels = NULL,
  groups = NULL,
  label_id = NULL,
  labels_key = "patient",
  title_column = "patient",
  subtitle_column = "text",
  group_column = "group",
  group_colours = NULL,
  boxes = NULL,
  box_colour = "ink",
  box_width = 0.5,
  box_size = NULL,
  style = ManuscriptStyle()
)
Arguments
- data
A
CellMapData()result or a data frame of cells.- layers
List of layers (see Details).
- rest
Layer for all remaining cells, or
NULL.- exclusive
If
TRUE, a cell is drawn by the first layer that selects it only; withFALSEevery matching layer draws it.- point_extra
Points added to every marker diameter: sub-pixel markers of some renderers look denser than their nominal size (about 0.055 matches 'matplotlib' output at 450 dpi).
- title_align
"left"(title at the left edge, subtitle after it) or"centre"(title centred above the map).- interface_colour
Colour of the interface zone.
- limits
Optional
c(xmin, xmax, ymin, ymax); default the field or the data range.- expand
Fraction of the data range added on each side when no field size is given (0.05 imitates automatic axis margins).
- scale_bar
NULLor a list:length,label,x(start, as a fraction of the map width from the left),y(distance of the bar from the lower map edge as a fraction of the width; negative values place it below the map),label_offset(signed distance of the label from the bar, as a fraction of the width; negative values hang it below),linewidth(points),size(points),colourandrelative_to("limits", the default, or"data": fractions of the data extent).- frame
Draw a frame around the map.
- frame_colour, frame_width
Frame colour and width (points).
- label
Optional text in the top-left corner of the map.
- label_colour, label_size
Label colour and size.
- title, subtitle
Optional title (bold) and subtitle (muted) above the map; taken from
labelswhenlabel_idis given.- title_colour
Title colour.
- title_size
Title size (points); the subtitle is 1 point smaller.
- labels
Optional data frame of titles, with
label_idselecting a row bylabels_key.- groups
Optional data frame giving the group of
label_id(columnlabels_keyandgroup_column); defaultlabels.- label_id, labels_key
Row selection in
labels.- title_column, subtitle_column, group_column
Columns of
labels.- group_colours
Named colours by
group_columnvalue for the title.- boxes
Optional data frame or list of squares to outline (
x,y,size), drawn withbox_colourandbox_width.- box_colour, box_width
Box colour and width (points).
- box_size
Box width used when
boxeshas nosizecolumn.- style
A
ManuscriptStyle()object.
Details
A layer is a list with column (default "label") and values, or
filter (named list of column to values, all must match); colour (one
colour, or a named list of value to colour for the layer's column);
size; optional edge_colour (default white), edge_width (default 0.25
points for sizes above 4, else 0) and z (drawing order). Cells in no
layer are drawn with rest (set rest = NULL to omit them).
Examples
set.seed(1)
d <- data.frame(x = runif(300, 0, 100), y = runif(300, 0, 100),
                label = sample(c("t", "a", "b"), 300, TRUE))
m <- CellMapData(d, centre = c(50, 50), size = 60,
                 interface = list(labels = "t", radius = 5, step = 2))
g <- PlotCellMap(m, layers = list(list(values = "t", colour = "#A6A6A6", size = 2.5),
                                  list(values = "b", colour = "#7B2FBE", size = 16)),
                 scale_bar = list(length = 10, label = "10 um"))
grid::grid.newpage(); grid::grid.draw(g)