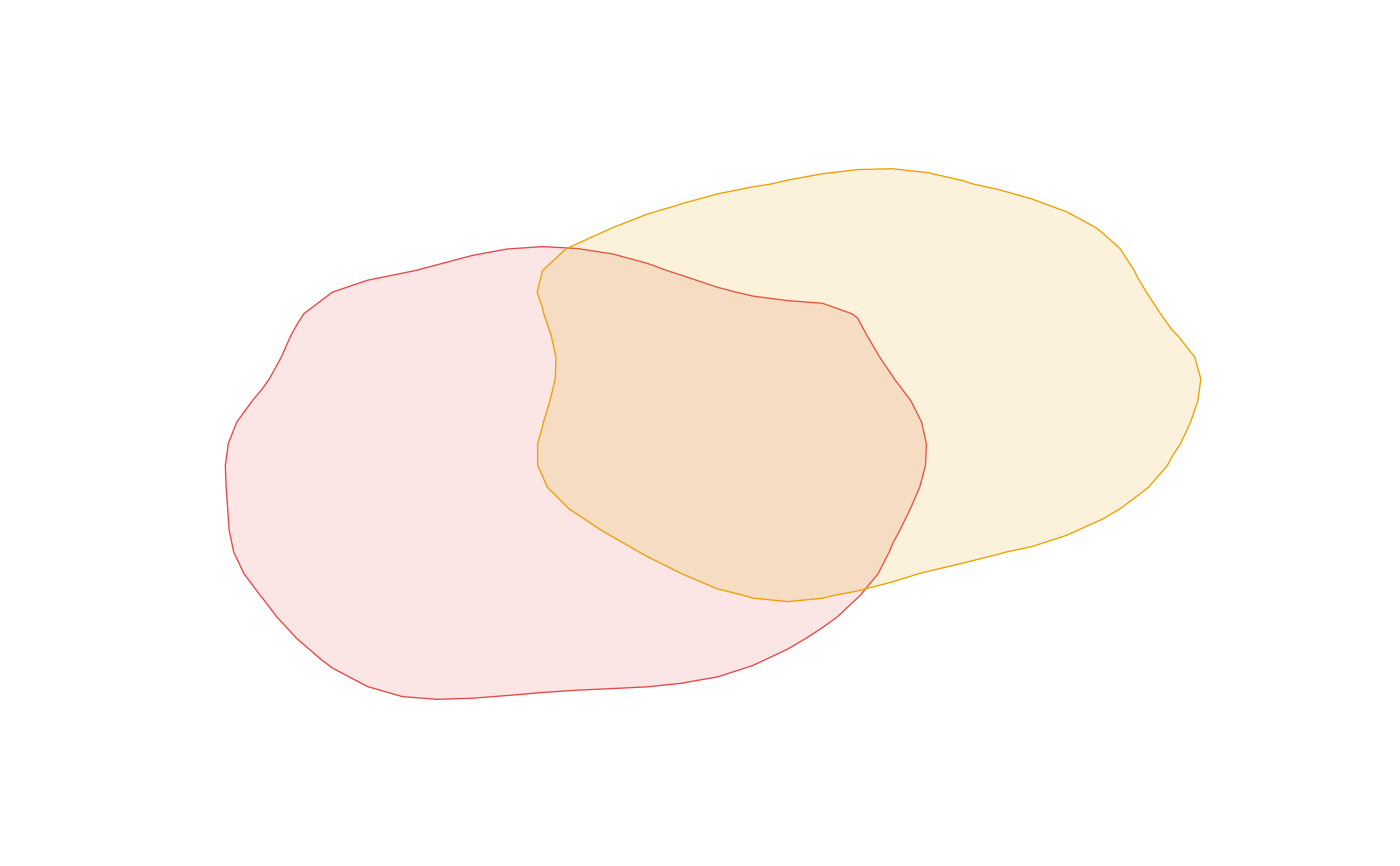
Draws, for each group (for example each patient), the region of the
embedding inside a density level as a lightly filled area with an
outline, as computed by DensityLevelContour(). Each group takes the
colour of its slot; a compact key of line segments with the group labels
is set centred below the panel.
Usage
PlotDensityOutlines(
  data,
  group = "group",
  limits = NULL,
  subset = NULL,
  colours = NULL,
  fill_alpha = 0.14,
  line_width = 0.5,
  key = TRUE,
  key_size = 4.2,
  key_ncol = 6,
  texts = NULL,
  values = NULL,
  style = ManuscriptStyle()
)
Arguments
- data
Contour data from
DensityLevelContour(): the group column,slot,label,kind("band"or"line"),piece,x,y.- group
Name of the group column.
- limits
Display limits as in
PlotEmbedding().- subset
Optional named list of columns and values to keep.
- colours
Colours by slot (vector) or named by group.
- fill_alpha
Opacity of the filled region.
- line_width
Outline width in points.
- key
Draw the key below the panel.
- key_size
Key text size in points.
- key_ncol
Key columns.
- texts, values
Free texts and template values.
- style
A
ManuscriptStyle()object.
Examples
set.seed(2)
pts <- data.frame(x = c(rnorm(300), rnorm(300, 2)), y = c(rnorm(300), rnorm(300, 1)),
                  g = rep(c("p1", "p2"), each = 300))
lim <- c(-4, 6, -4, 5)
cont <- DensityLevelContour(pts, group = "g", limits = lim, bins = 40)
PlotDensityOutlines(cont, group = "g", limits = lim, colours = c("#e34948", "#eda100"))