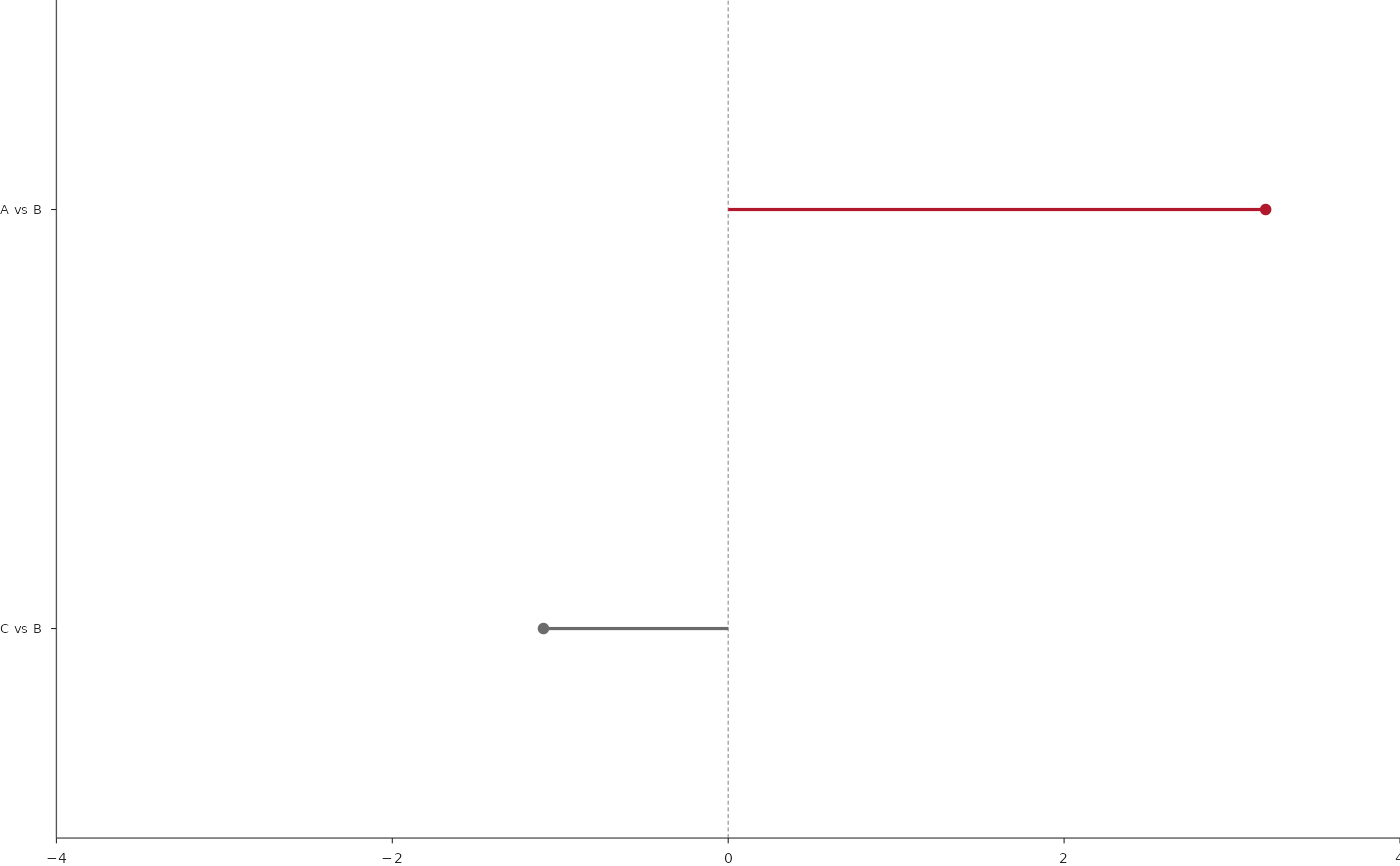
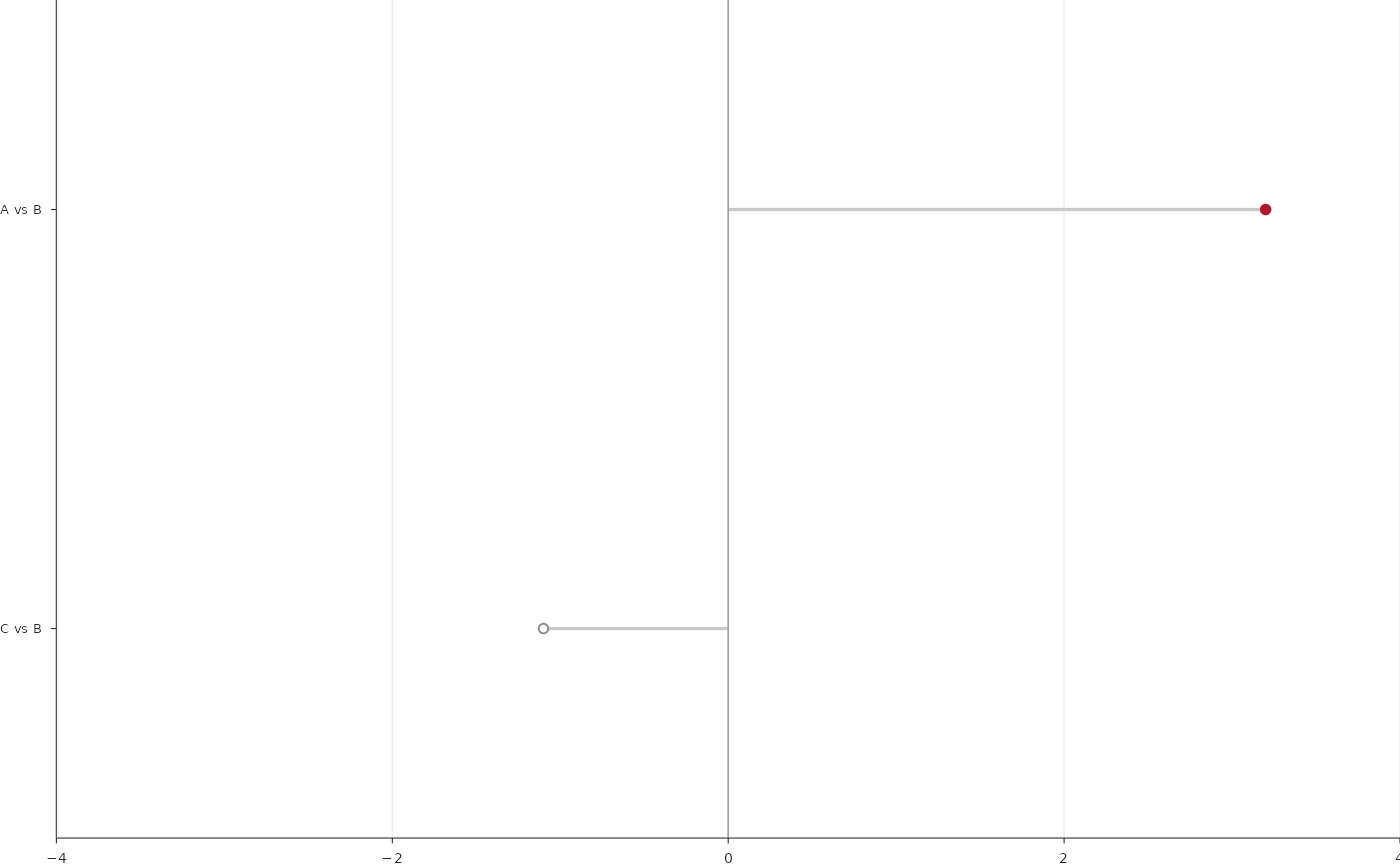
One row per contrast or endpoint: a segment from zero to the estimate
(not an interval) ending in a point, and a P-value text at the right.
With marker = "colour" points, segments and text take
significant_colour when q is below alpha and other_colour
otherwise; with marker = "open" significant rows have filled points in
significant_colour and the others open points with an open_colour
edge, segments are drawn in segment_colour and the text is ink or
muted. The x axis is symmetric around zero unless x_limits are given.
Usage
PlotGroupDifferences(
  data,
  row = "contrast",
  estimate = "diff",
  q = "q_BH",
  row_order = NULL,
  row_labels = NULL,
  alpha = 0.05,
  significant_colour = "significant",
  other_colour = "muted",
  label = "{diff|sf1}; p = {p|p}; q = {q_BH|p}",
  label_size = 4.6,
  label_x = 1.04,
  label_title = NULL,
  label_title_size = 4.8,
  span = 1.25,
  linewidth = 1.2,
  point_size = 11,
  marker = c("colour", "open"),
  segment_colour = "#C9C9C9",
  open_colour = "open_edge",
  open_size = 13,
  open_stroke = 0.7,
  x_limits = NULL,
  y_limits = NULL,
  x_breaks = NULL,
  x_nbins = 6,
  x_label = NULL,
  grid = c("none", "x"),
  tick_size_y = 5,
  title_size = 5,
  box_mm = NULL,
  style = ManuscriptStyle()
)
Arguments
- data
Test table, one row per contrast.
- row, estimate, q
Columns of the contrast, estimate and the (adjusted or nominal) P value compared with
alpha.- row_order
Rows from top to bottom.
- row_labels
Named tick labels.
- alpha
Threshold for
q.- significant_colour, other_colour
Colours.
- label
Template written at the right (see
FormatTemplate()).- label_size, label_x
Label size and position (panel fraction).
- label_title
Optional column title written above the labels.
- label_title_size
Its size.
- span
Half-width of the axis relative to the largest absolute estimate.
- linewidth, point_size
Segment width (points) and point area.
- marker
"colour"or"open"(see Details).- segment_colour
Segment colour with
marker = "open".- open_colour, open_size, open_stroke
Open points: edge colour, area and edge width.
- x_limits
Optional x limits.
- y_limits
Optional y limits (rows are at 1 to n from the bottom).
- x_breaks, x_nbins
x ticks.
- x_label
Axis title.
- grid
"none"or"x"(vertical grid lines).- tick_size_y
Row label size.
- title_size
Axis title size.
- box_mm
Size of the data area
c(width, height)in millimetres, passed byRenderFigure(); used by"auto"tick intervals (seeNiceBreaks()).- style
A
ManuscriptStyle()object.