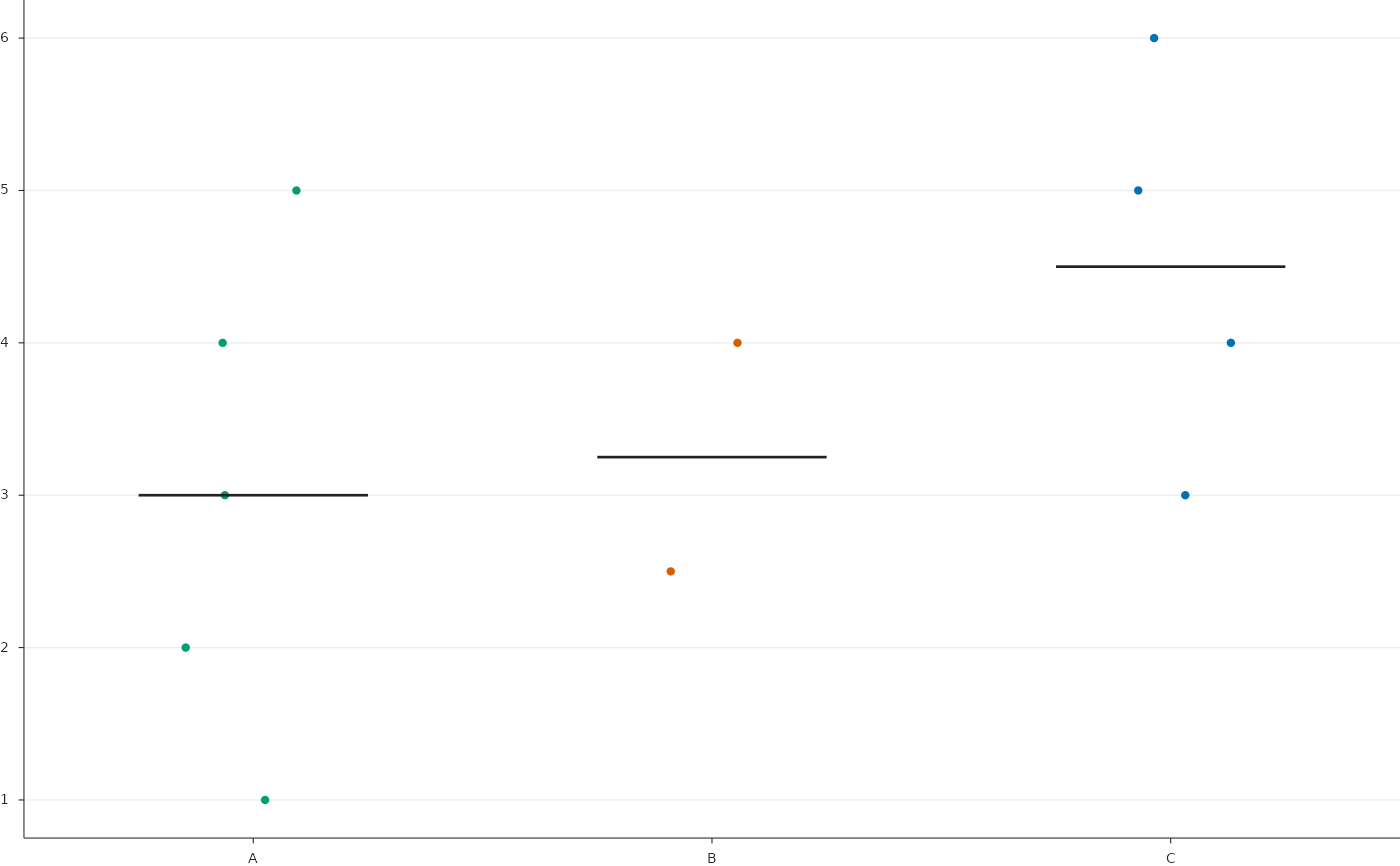
Jittered points of one value per unit (patient) for each group, with a
bar at the group median. With category, groups are drawn side by side
within each category (for example one neighbourhood per category) with
faint separators between categories. On a logarithmic axis, values at or
below zero are not drawn and counted in a note at the bottom.
Usage
PlotGroupStrip(
  data,
  value = "value",
  group = "group",
  groups = NULL,
  group_labels = NULL,
  group_colours = NULL,
  colour_by = NULL,
  point_colours = NULL,
  category = NULL,
  category_order = NULL,
  category_labels = NULL,
  dodge = 0.27,
  jitter = NULL,
  seed = 3,
  point_size = 10,
  median_width = NULL,
  median_linewidth = 1,
  log_y = FALSE,
  zero_text = "{n} at zero",
  y_limits = NULL,
  y_breaks = NULL,
  y_nbins = 9,
  y_label = NULL,
  x_label = NULL,
  tick_size = NULL,
  title_size = 5.6,
  box_mm = NULL,
  style = ManuscriptStyle()
)
Arguments
- data
Tidy data: one row per unit (and category).
- value, group
Columns.
- groups
Group order.
- group_labels
Named tick labels per group (for example short names).
- group_colours
Named colours per group.
- colour_by
Optional column colouring the points instead of the group (for example the clinical group of each unit), with
point_colours.- point_colours
Named colours per value of
colour_by.- category
Optional category column;
category_orderandcategory_labelsorder and label it.- category_order, category_labels
Category order and tick labels.
- dodge
Offset between groups within a category.
- jitter
Half-width of the horizontal jitter.
- seed
Seed of the jitter (presentation only).
- point_size
Point area (pt^2).
- median_width
Half-width of the median bar (x units).
- median_linewidth
Its width in points.
- log_y
Logarithmic y axis.
- zero_text
Template for the count of values at or below zero (field
{n}).- y_limits, y_breaks, y_nbins
y axis.
- y_label, x_label
Axis titles.
- tick_size
Tick label size.
- title_size
Axis title size.
- box_mm
Size of the data area
c(width, height)in millimetres, passed byRenderFigure(); used by"auto"tick intervals (seeNiceBreaks()).- style
A
ManuscriptStyle()object.