Draws one raster image, a gallery of images, or a schematic of shapes.
Usage
PlotImage(
  data,
  row = NULL,
  row_levels = NULL,
  tile_mm = 10,
  view_gap_mm = 0.36,
  field_gap_mm = 1.8,
  row_pitch_mm = 11,
  column_labels = NULL,
  header_size = 4.6,
  header_colour = "muted",
  header_gap_mm = 0.5,
  row_labels = NULL,
  cross = list(colour = "#FFD54F", size = 3.5, linewidth = 0.5),
  corner = NULL,
  scale_bar = NULL,
  title = NULL,
  total = NULL,
  title_size = 5.6,
  title_gap_mm = 4.5,
  interpolate = TRUE,
  style = ManuscriptStyle()
)
Arguments
- data
An array/matrix, a
CompositeFields()result or aSchematicShapes()result.- row
Column of the gallery info defining gallery rows;
NULLgives one row per field.- row_levels
Optional order of the row values.
- tile_mm, view_gap_mm, field_gap_mm, row_pitch_mm
Gallery geometry.
- column_labels
Optional header texts per view (repeated for every field of the widest row) with
header_sizeandheader_colour.- header_size, header_colour, header_gap_mm
Header text settings.
- row_labels
Optional list of row-label lines, each a list with
column(info column) ormap(named list from the row value),dy(fraction of the tile height from the bottom),size,colour,bold,replace(named list of text substitutions) andx_mm(position relative to the panel's left edge; negative is left of it);hjustaligns the text.- cross
Draw a centre cross on every tile (list with
colour,sizepoints,linewidthpoints) orNULL.- corner
Optional list with
column,view,size,colour: text in the top-left corner of tiles of that view.- scale_bar
Optional list:
length(physical units),pixel_size,view,linewidth,colour,which("first"tile only or"row": first tile of every row).- title
Optional gallery title placed above the column headers;
{n}is replaced by the number of fields shown and{total}by the number of rows oftotal.- total
Optional data frame counted for
{total}.- title_size, title_gap_mm
Title size (points) and distance above the tiles (mm).
- interpolate
Smooth raster scaling.
- style
A
ManuscriptStyle()object.
Details
A single image (RGB array or grey matrix with values in 0-1) fills the panel box with optional centre cross, scale bar and corner label.
A
CompositeFields()result is laid out as a gallery: one gallery row per value ofrow(or per field), each field's views side by side, in absolute millimetres from the top-left of the panel box: tiles oftile_mm,view_gap_mmbetween the views of a field,field_gap_mmbetween fields androw_pitch_mmfrom row to row. Column headers, row labels (several lines, from columns of the fields' rows or a label map), centre crosses, corner labels and a scale bar are optional.A
SchematicShapes()result is drawn in its own coordinates with equal aspect.
Examples
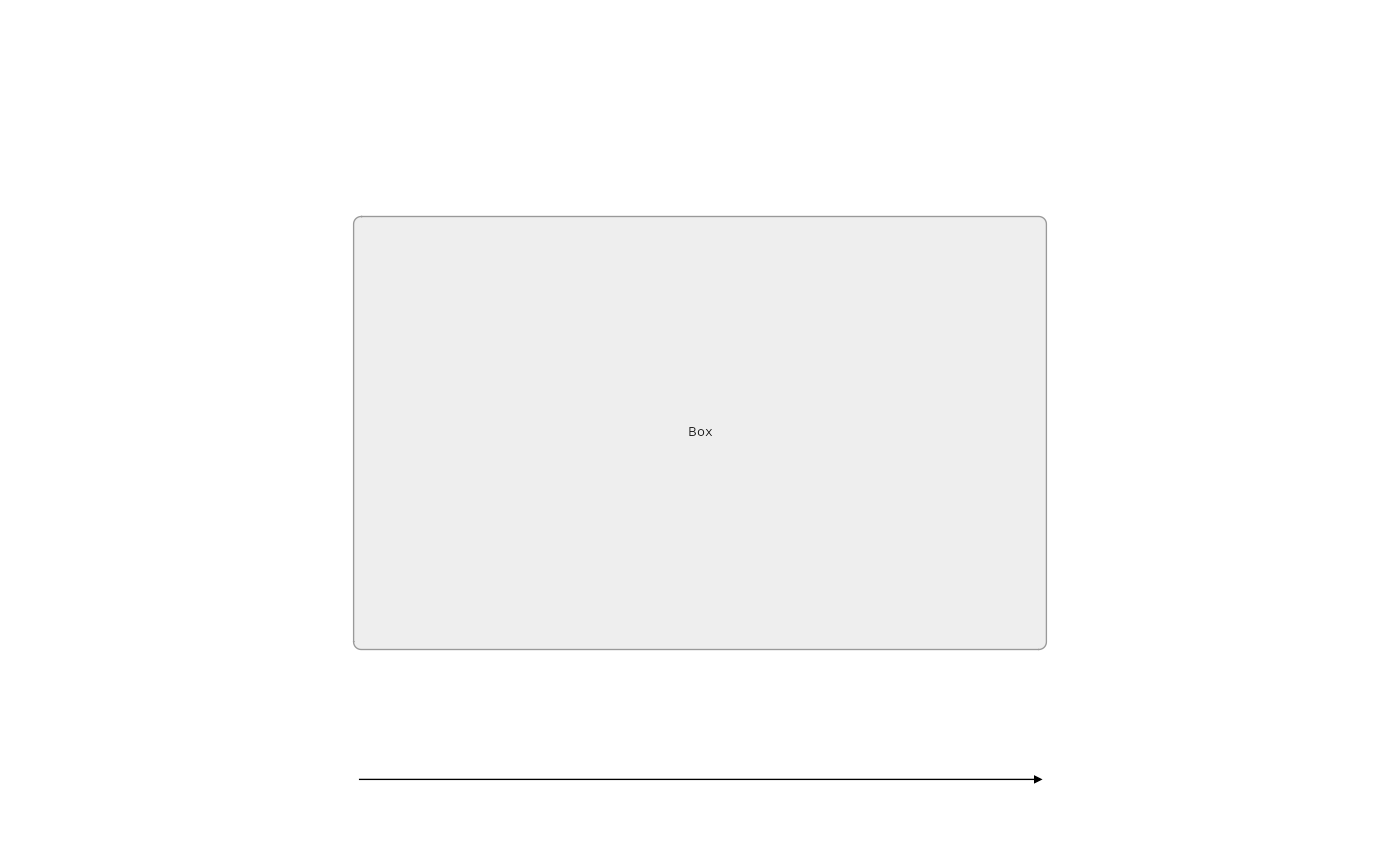
shapes <- SchematicShapes(shapes = list(
list(type = "roundrect", x = 0.5, y = 0.5, w = 0.8, h = 0.5, fill = "#EEEEEE",
colour = "#999999", r = 1),
list(type = "text", x = 0.5, y = 0.5, label = "Box"),
list(type = "arrow", x = 0.1, y = 0.1, xend = 0.9, yend = 0.1, colour = "#000000")))
grid::grid.newpage(); grid::grid.draw(PlotImage(shapes))
 set.seed(4)
grid::grid.newpage(); grid::grid.draw(PlotImage(array(runif(300), c(10, 10, 3))))