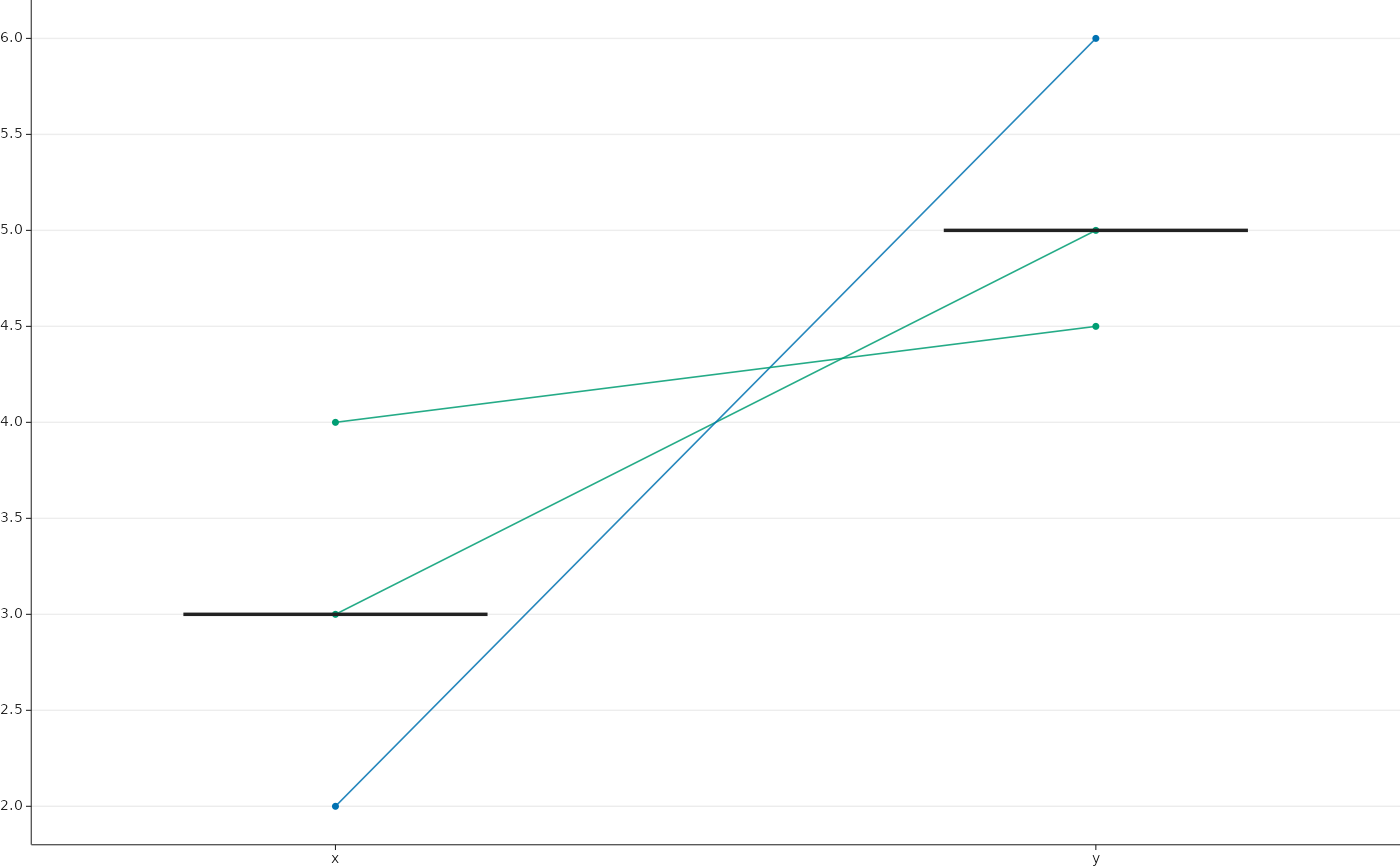
One line per patient across ordered conditions, coloured by clinical
group, with a short bold bar at the median of each condition. Patients
flagged in excluded are drawn dashed with open symbols and are left out
of the medians, as patients not included in a test.
Usage
PlotPairedPatients(
  data,
  patient = "patient",
  group = "group",
  condition = "condition",
  value = "value",
  conditions = NULL,
  labels = NULL,
  excluded = NULL,
  group_colours = NULL,
  log_y = FALSE,
  y_label = NULL,
  x_label = NULL,
  y_limits = NULL,
  y_nbins = "auto",
  box_mm = NULL,
  style = ManuscriptStyle()
)
Arguments
- data
Tidy data: one row per patient and condition.
- patient, group, condition, value
Column names.
- conditions
Condition order; defaults to first appearance.
- labels
Tick labels for the conditions; default
conditions.- excluded
Optional logical column marking patients outside the test.
- group_colours
Named colours per group level.
- log_y
Logarithmic y axis.
- y_label, x_label
Axis titles.
- y_limits
Optional y limits.
- y_nbins
Maximum number of y intervals of the tick locator (see
NiceBreaks());"auto"follows the axis length.- box_mm
Size of the data area
c(width, height)in millimetres, passed byRenderFigure().- style
A
ManuscriptStyle()object.