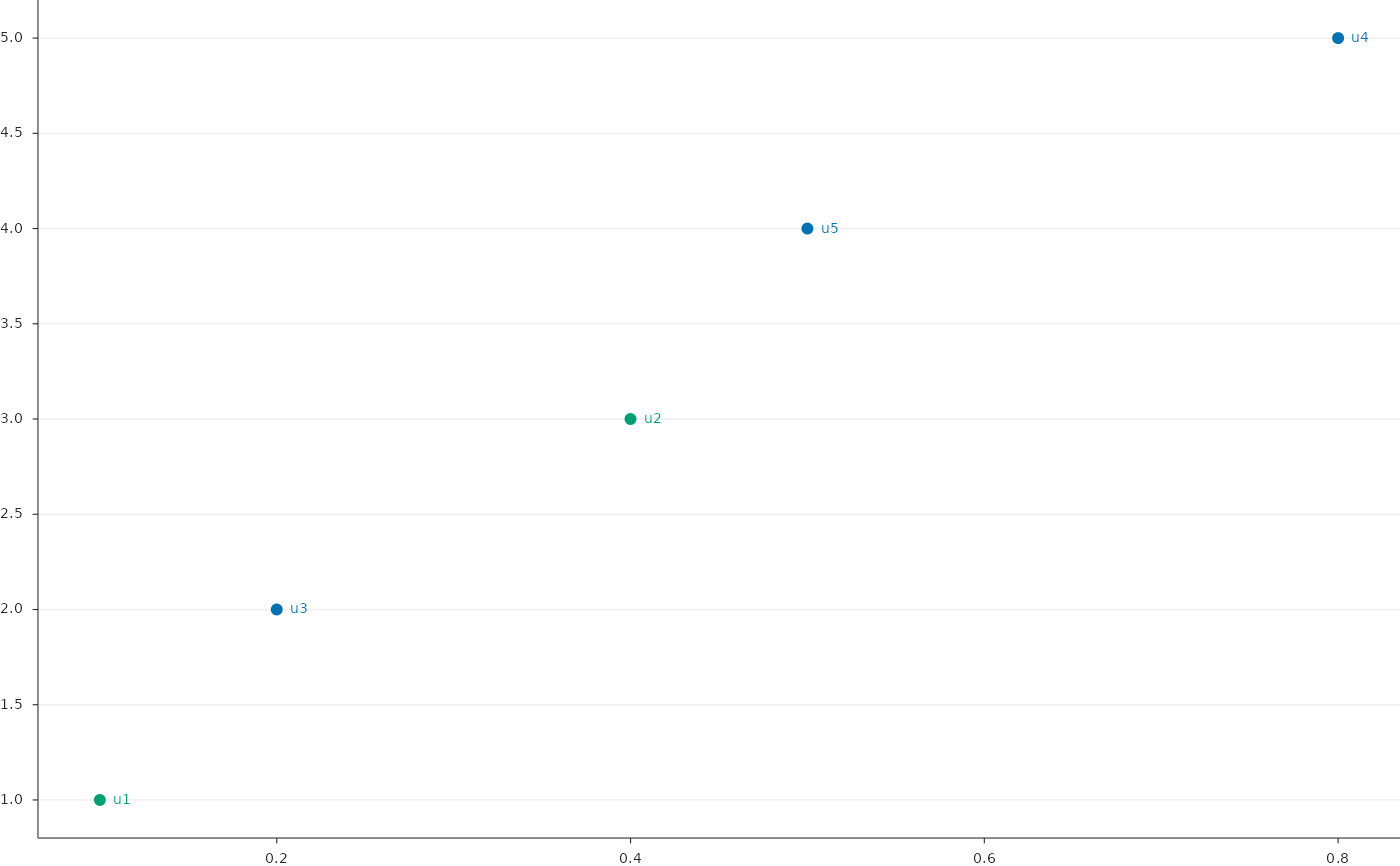
Points coloured by the group of each unit, with optional open symbols for flagged units, labels with offsets in points, lines connecting the points of a unit across conditions (paired values), median bars and categorical axes. A categorical y axis gives one row per unit (dot rows), with tick labels coloured by group, separators between groups and a "not estimable" text where the value is missing.
Usage
PlotScatterGroups(
  data,
  x = "x",
  y = "y",
  group = "group",
  group_colours = NULL,
  id = NULL,
  x_order = NULL,
  x_labels = NULL,
  y_order = NULL,
  y_labels = NULL,
  colour_ticks = TRUE,
  open = NULL,
  size = 20,
  stroke = 0,
  open_stroke = 0.7,
  connect = FALSE,
  linewidth = 0.65,
  line_alpha = 0.85,
  open_linewidth = NULL,
  open_linetype = "32",
  open_shift = NULL,
  open_shift_default = 0,
  summary = FALSE,
  summary_half = 5.9,
  summary_linewidth = 1.4,
  label = NULL,
  label_only = NULL,
  label_first = FALSE,
  label_offset = c(5, 0),
  label_offsets = NULL,
  label_size = 5.3,
  label_vjust = 0.5,
  label_colour = "group",
  missing_text = "NE",
  missing_size = 5.3,
  separators = FALSE,
  x_limits = NULL,
  y_limits = NULL,
  x_breaks = NULL,
  y_breaks = NULL,
  x_nbins = 6,
  y_nbins = 9,
  log_y = FALSE,
  x_label = NULL,
  y_label = NULL,
  grid = c("y", "x", "both", "none"),
  tick_size = NULL,
  title_size = NULL,
  stats = NULL,
  note = NULL,
  note_xy = c(0.97, 0.96),
  note_hjust = 1,
  note_vjust = 1,
  note_size = 4.8,
  note_colour = "muted",
  reference = NULL,
  reference_x = "x",
  reference_group = NULL,
  reference_linewidth = 0.5,
  reference_linetype = "32",
  ties = FALSE,
  tie_dodge = 0.16,
  tie_label_dx = c(0.12, 0.08),
  tie_label_size = 4.3,
  tie_label_colour = "muted",
  box_mm = NULL,
  style = ManuscriptStyle()
)
Arguments
- data
Tidy data.
- x, y
Columns. Character columns are categorical.
- group
Group column.
- group_colours
Named colours per group.
- id
Unit column (for connections, labels and offsets).
- x_order, x_labels
Order and tick labels of a categorical x.
- y_order, y_labels
Order (top to bottom) and tick labels of a categorical y;
y_labels = FALSEhides them.- colour_ticks
Colour categorical y tick labels by group.
- open
Optional logical column: open symbols (and dashed connections) when
TRUE.- size
Point area (pt^2).
- stroke
Edge width of filled points (pt); open symbols use
open_stroke.- open_stroke
Edge of open symbols.
- connect
Connect the points of each
idacross x.- linewidth, line_alpha
Connection style (points).
- open_linewidth, open_linetype
Width and dash pattern of connections of open units (default:
linewidth, dashed).- open_shift
Horizontal shift of open units (x units); a named list gives shifts per
idoverridingopen_shift_default.- open_shift_default
Shift for open units without an entry.
- summary
Draw a median bar per x over units that are not open.
- summary_half, summary_linewidth
Half-width (points) and width of median bars.
- label
Optional label column; labels of points outside the axes are not drawn.
- label_only
Optional logical column: label only these rows.
- label_first
Label only the first point (lowest x) of each unit.
- label_offset
Default label offset in points (
c(dx, dy)).- label_offsets
Named list of offsets per
id.- label_size
Label size;
label_colour"group"uses group colours.- label_vjust
Vertical justification of labels at their offset (0.2 is close to baseline alignment).
- label_colour
Label colour.
- missing_text
Text for missing x values on a categorical y axis.
- missing_size
Its size.
- separators
Draw lines between rows of different groups (categorical y).
- x_limits, y_limits, x_breaks, y_breaks, x_nbins, y_nbins
Axes.
- log_y
Logarithmic y axis (values at or below zero are not drawn).
- x_label, y_label
Axis titles.
- grid
"y","x","both"or"none".- tick_size
Tick label size, or
c(x, y).- title_size
Axis title size, or
c(x, y).- stats
Optional one-row data frame for
note(default: first row ofdata).- note
Optional template (see
FormatTemplate()) written atnote_xy(panel fractions), for example a correlation coefficient.- note_xy, note_hjust, note_vjust, note_size, note_colour
Note placement and style.
- reference
Optional data frame of vertical reference lines (for example the value chosen in each analysis), one per row.
- reference_x
Column of
referencewith the x positions.- reference_group
Optional column of
referencewhose values take their colour fromgroup_colours.- reference_linewidth, reference_linetype
Reference line width (points) and dash pattern.
- ties
Draw units at the same position side by side (
tie_dodgex units apart) and write theirlabels once, joined by commas, right of the group attie_label_dx[1] + tie_label_dx[2] * nx units.- tie_dodge, tie_label_dx, tie_label_size, tie_label_colour
Layout and style of tied units and their labels.
- box_mm
Size of the data area
c(width, height)in millimetres, passed byRenderFigure(); used by"auto"tick intervals (seeNiceBreaks()).- style
A
ManuscriptStyle()object.