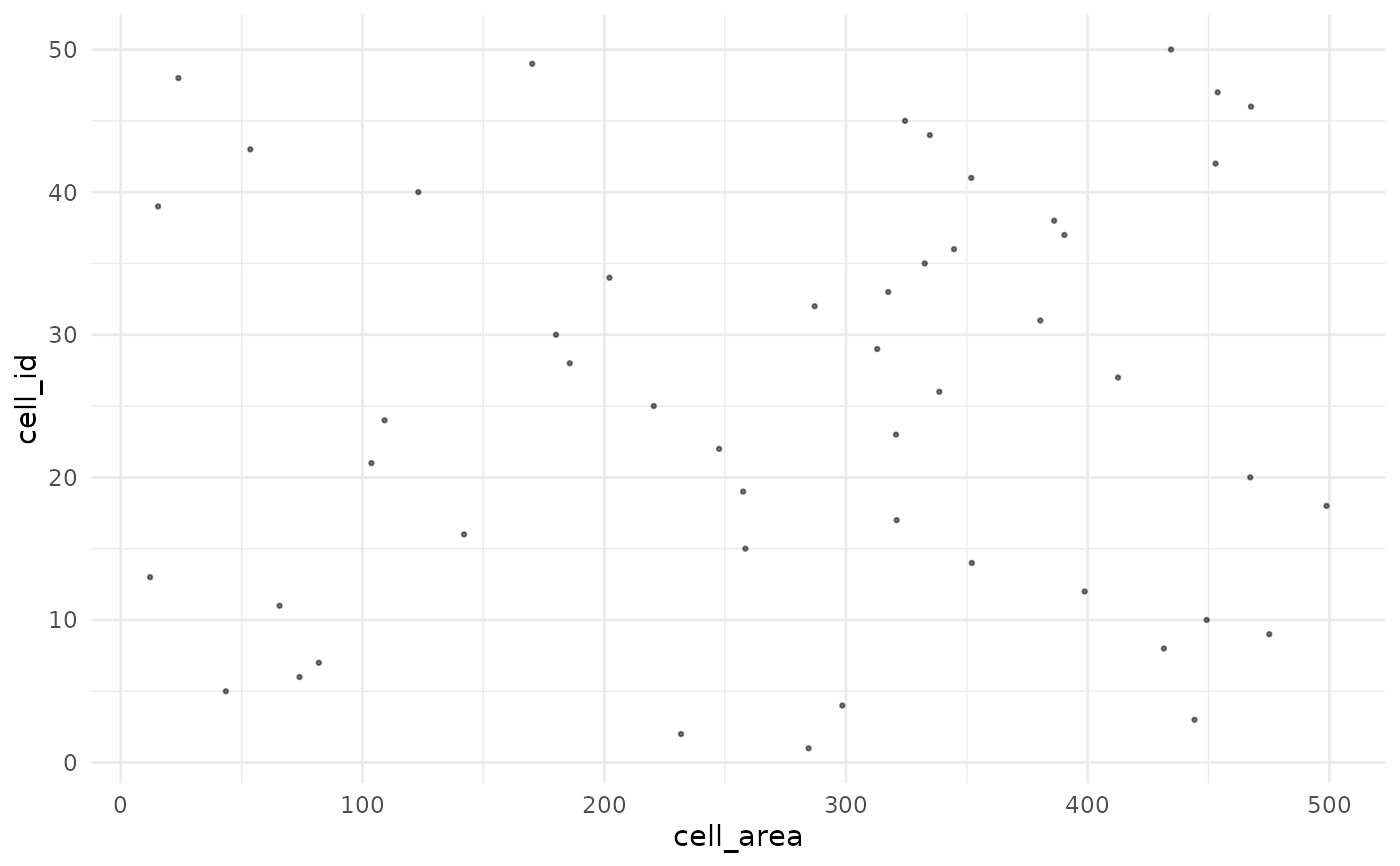
Scatter plot of two QC metrics (e.g. cell area vs total intensity).
Arguments
- object
An
SpatialCellDataobject.- x
Character. Metadata column for x-axis.
- y
Character. Metadata column for y-axis.
- colour_by
Character or
NULL. Metadata column for colour.- pt_size
Numeric. Default
0.5.
Examples
counts <- matrix(rnorm(100), nrow = 50,
                 dimnames = list(NULL, c("CD3", "CD8")))
coords <- data.frame(x = runif(50), y = runif(50))
meta <- data.frame(cell_id = 1:50, sample_id = "s1",
                   cell_area = runif(50, 10, 500))
obj <- CreateSpatialObject(counts, coords, meta)
QCPlot(obj, x = "cell_area", y = "cell_id")