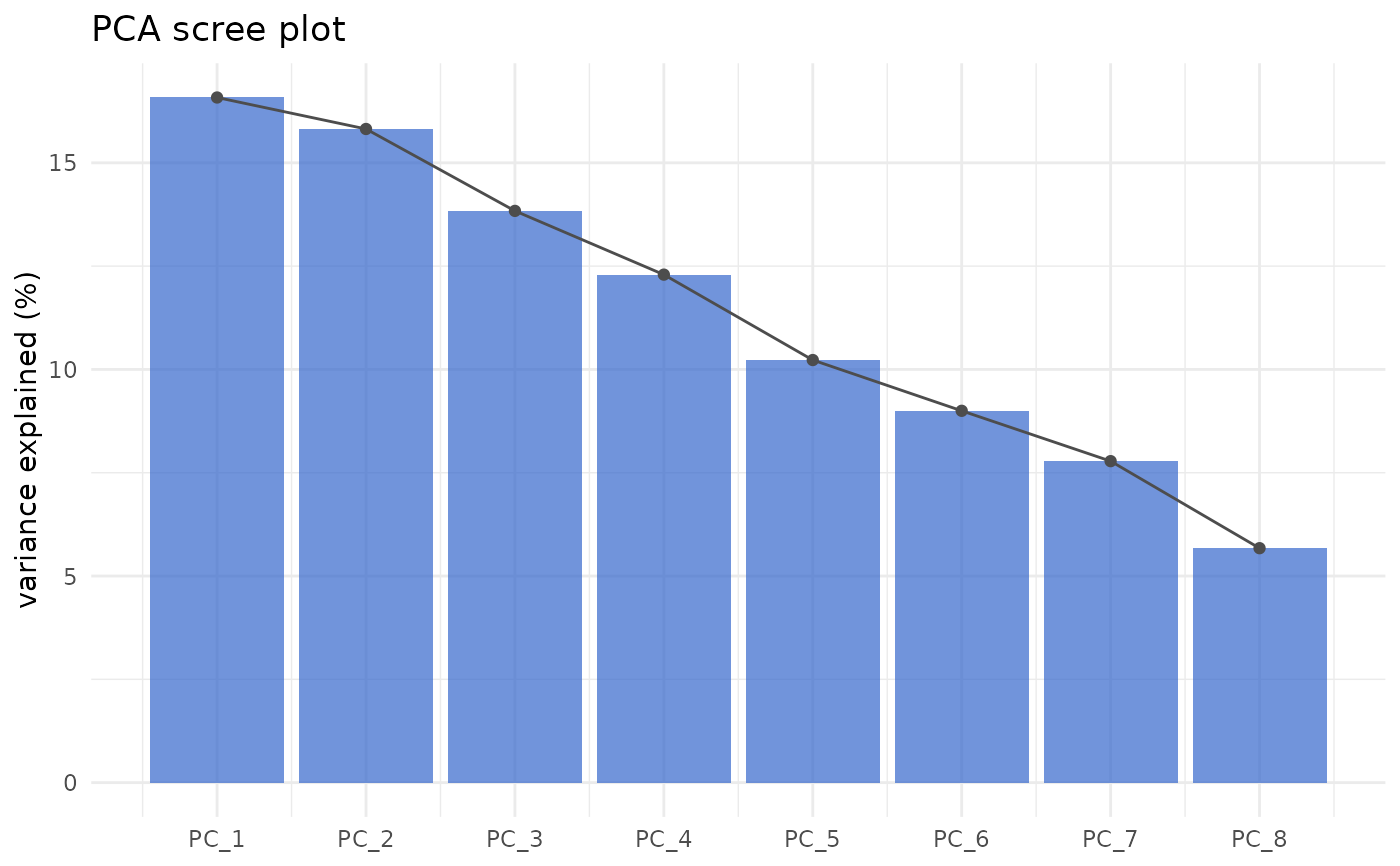
Bar-and-line plot of the percent variance explained by each principal component – the standard tool for choosing how many PCs to retain.
Arguments
- object
A
SpatialCellData-classobject.- n_pcs
Integer or
NULL. Number of PCs to show. Default all.
Examples
counts <- matrix(rnorm(500), nrow = 50,
                 dimnames = list(NULL, paste0("M", 1:10)))
coords <- data.frame(x = runif(50), y = runif(50))
obj <- RunPCA(CreateSpatialObject(counts, coords), n_pcs = 8)
ScreePlot(obj)