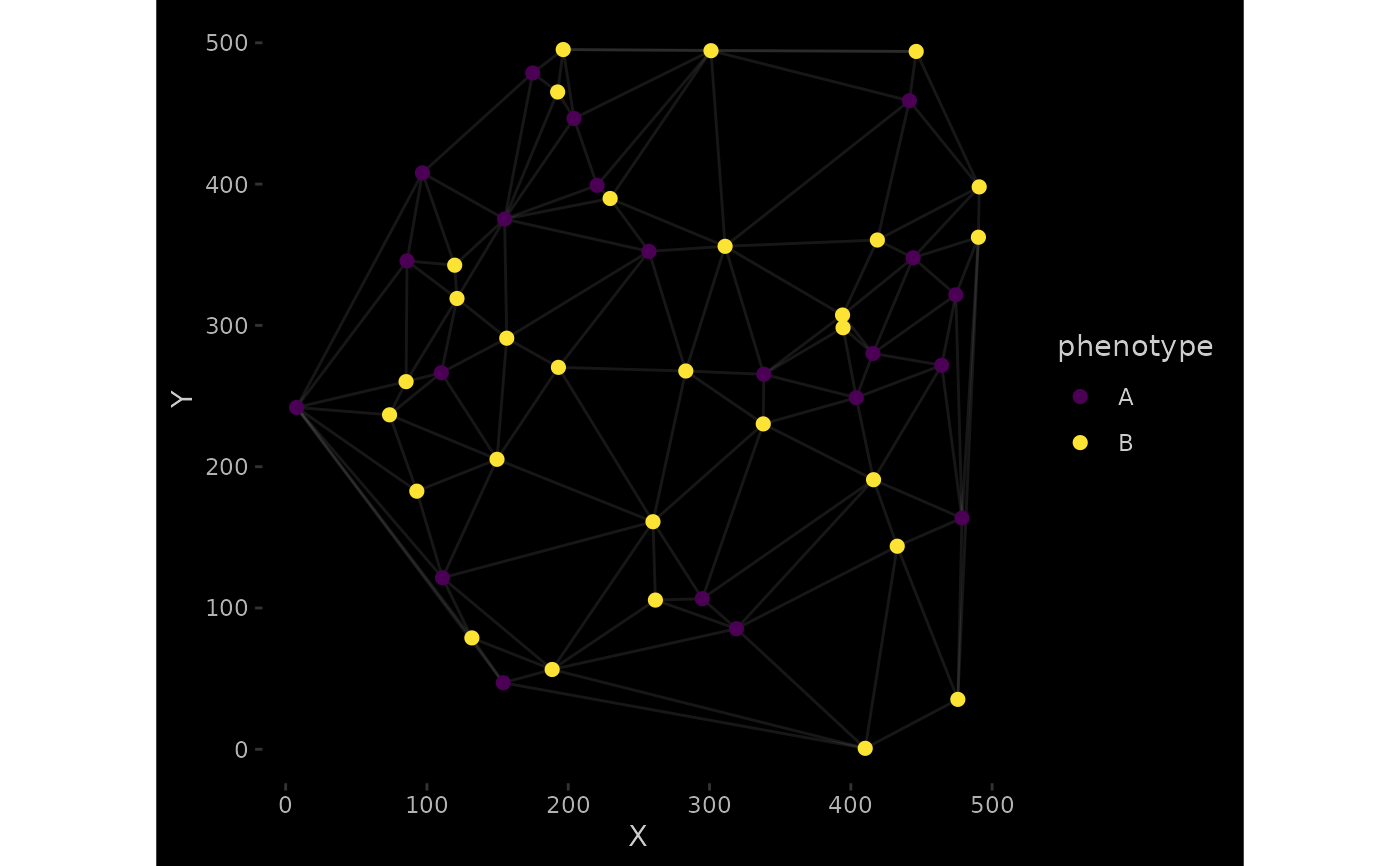
Plots cells as circles connected by edges from Delaunay triangulation or nearest-neighbour graph, coloured by phenotype. Matches the network visualisation style with coloured nodes on dark background.
Usage
SpatialNetworkPlot(
  object,
  edges = NULL,
  colour_by = "phenotype",
  colours = NULL,
  pt_size = 2,
  edge_alpha = 0.15,
  edge_colour = "grey60",
  dark_theme = TRUE
)
Arguments
- object
An
SpatialCellDataobject.- edges
Data frame with columns
fromandto(row indices), as returned byDelaunayNetworkorFindNeighbours. IfNULLand the spatial slot containsdelaunay_edges, those are used.- colour_by
Character. Metadata column for node colour. Default
"phenotype".- colours
Named character vector or
NULL.- pt_size
Numeric. Node size. Default
2.- edge_alpha
Numeric. Edge transparency. Default
0.15.- edge_colour
Character. Edge colour. Default
"grey60".- dark_theme
Logical. Default
TRUE.
Examples
counts <- matrix(rnorm(100), nrow = 50,
                 dimnames = list(NULL, c("CD3", "CD8")))
coords <- data.frame(x = runif(50, 0, 500), y = runif(50, 0, 500))
meta <- data.frame(cell_id = 1:50, sample_id = "s1",
                   phenotype = sample(c("A", "B"), 50, TRUE))
obj <- CreateSpatialObject(counts, coords, meta)
obj <- DelaunayNetwork(obj)
SpatialNetworkPlot(obj)