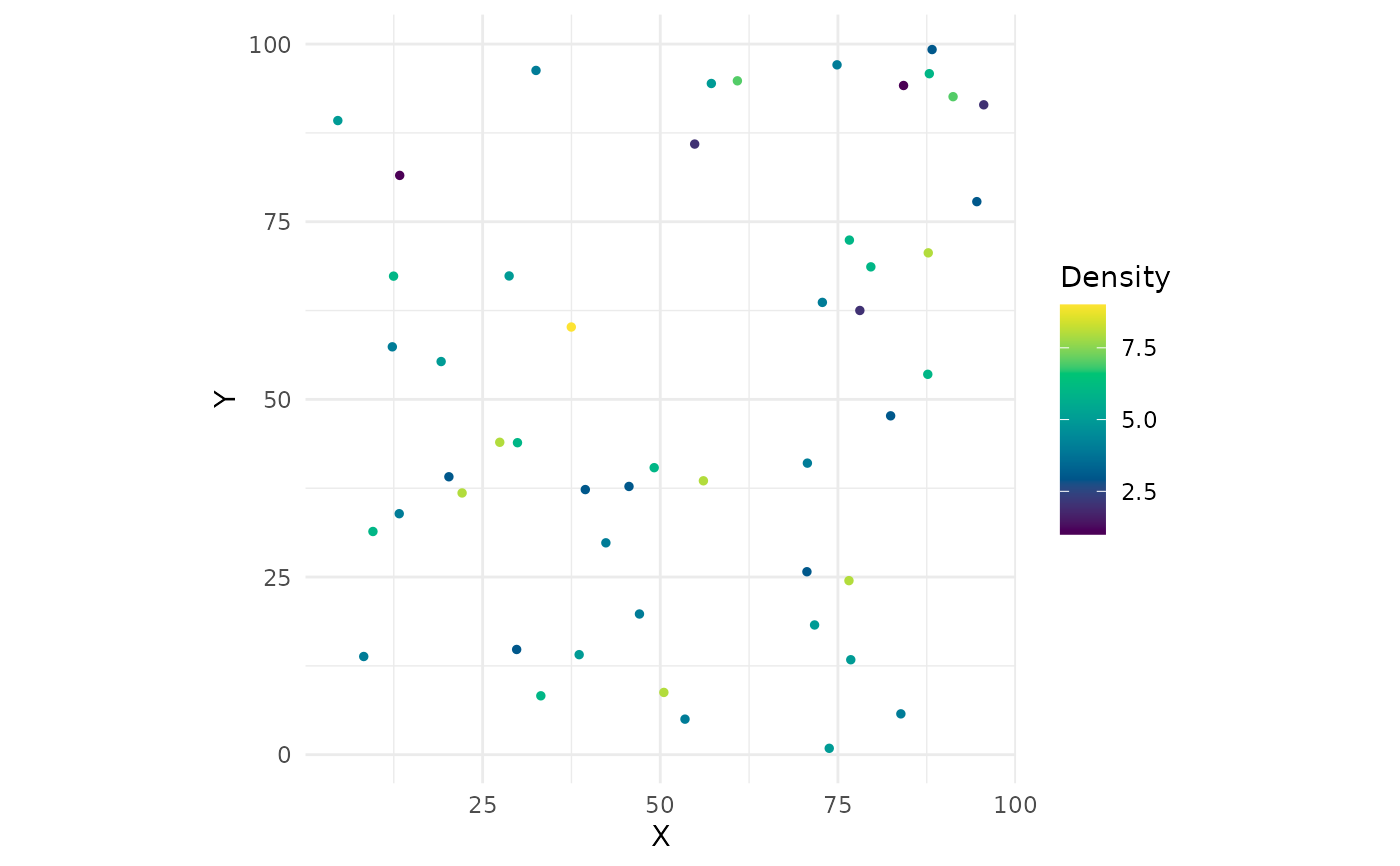
Creates a scatter plot with point size or colour scaled by local cell density.
Arguments
- dt
A
data.tablewith columnsx,y, anddensity(as returned bycell_density()).- point_size
Numeric. Base point size. Default
1.- title
Character string or
NULL. Plot title.
Examples
dt <- data.table::data.table(
  sample_id = "s1", cell_id = 1:50,
  x = runif(50, 0, 100), y = runif(50, 0, 100),
  density = rpois(50, 5)
)
plot_density(dt)