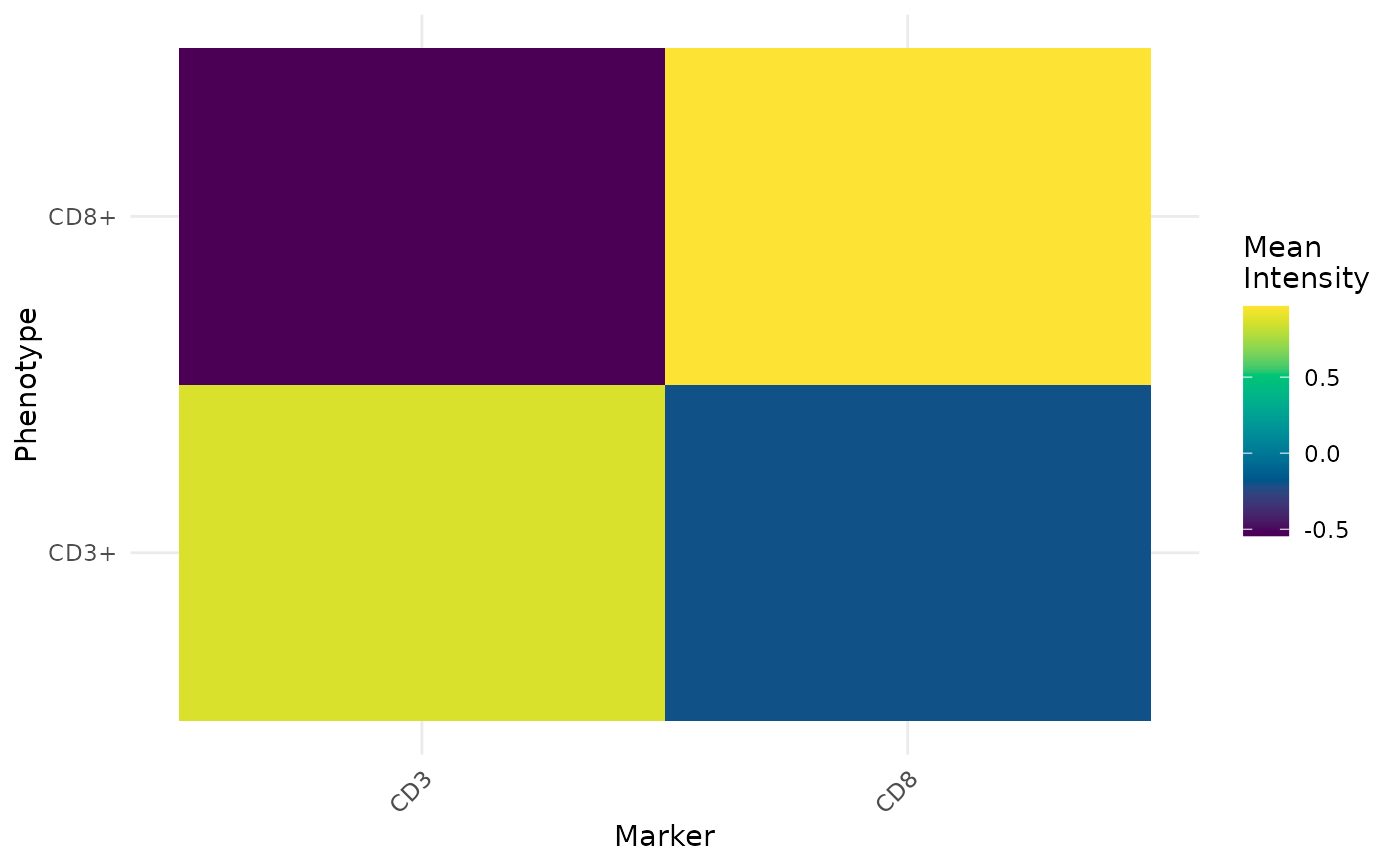
Displays a heatmap of mean marker intensities per phenotype.
Usage
plot_heatmap(dt, markers = NULL, title = NULL)
Arguments
- dt
A data.table with marker columns and a phenotype column.
- markers
Character vector or NULL. Markers to include. If NULL,
all marker columns are used.
- title
Character string or NULL. Plot title.
Examples
dt <- data.table::data.table(
  sample_id = "s1", cell_id = 1:60,
  x = runif(60), y = runif(60),
  CD3 = c(rnorm(30, 1), rnorm(30, 0)),
  CD8 = c(rnorm(30, 0), rnorm(30, 1)),
  phenotype = rep(c("CD3+", "CD8+"), each = 30)
)
plot_heatmap(dt)