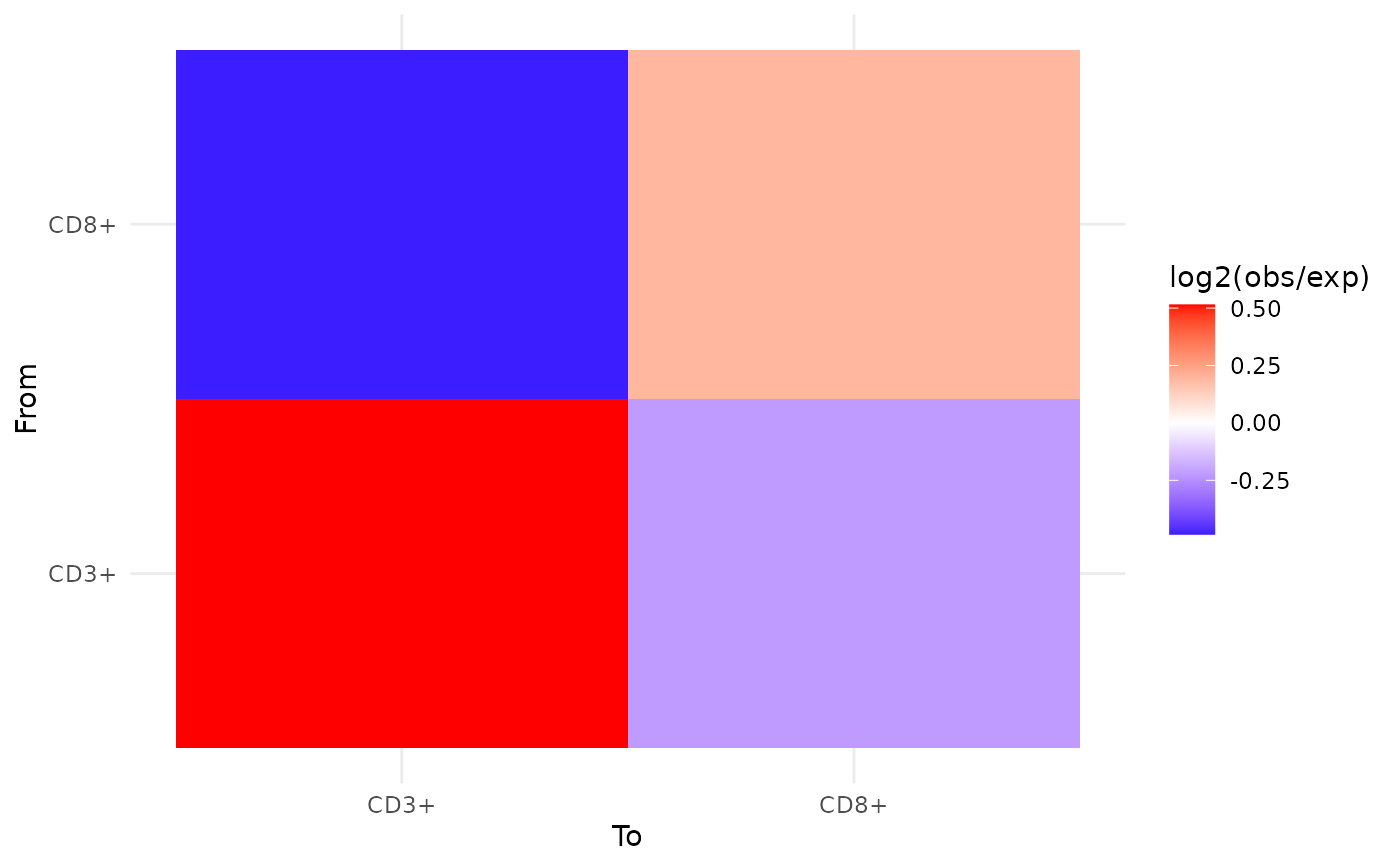
Visualises the spatial interaction matrix as a heatmap.
Arguments
- interactions
A
data.tableas returned byinteraction_matrix().- title
Character string or
NULL. Plot title.
Visualises the spatial interaction matrix as a heatmap.
A data.table as returned by interaction_matrix().
Character string or NULL. Plot title.