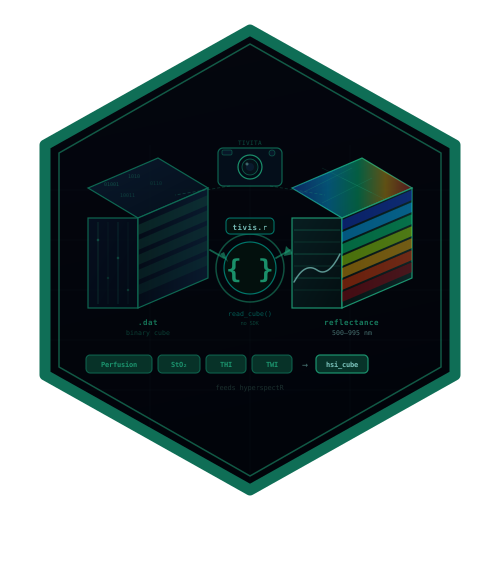

Read hyperspectral recordings written by the Diaspective Vision TIVITA Suite, used for intraoperative tissue and perfusion imaging.
tivis.r is the TIVITA counterpart to cuvis.r, which covers Cubert snapshot cameras. The important practical difference: the TIVITA container is a plain binary format, so this package needs no vendor SDK and contains no compiled code — nothing to install beyond R itself.
Both packages feed hyperspectR, which owns the hsi_cube class and the analysis pipeline.
Usage
library(tivis.r)

# Inspect a recording's geometry without reading 123 MB of samples
tivis_read_header("2019_11_25_13_29_24_SpecCube.dat")
#> $width  [1] 640
#> $height [1] 480
#> $bands  [1] 100

# Read the cube: (rows, cols, bands), with wavelengths attached
cube <- tivis_read_cube("2019_11_25_13_29_24_SpecCube.dat")
dim(cube)
#> [1] 480 640 100

# Everything the Suite stored for one capture
m <- tivis_measurement("2019_11_25_13_29_24_SpecCube.dat")
m$metadata$Camera$Exposure
names(m$references)
#> "NIR-Perfusion" "Oxygenation" "RGB-Image" "THI" "TWI"

# Scan an archive cheaply (headers only)
tivis_list_measurements("/archive/tivita")
The file format
TIVITA does not publish a specification, so the format was determined empirically:
| Header | 12 bytes: three big-endian uint32 — width, height, bands |
| Samples | big-endian float32
|
| Band order | band-interleaved-by-pixel (all bands of a pixel contiguous) |
| Pixel order | column-major — y varies fastest |
| Wavelengths | 500–995 nm in 5 nm steps (100 bands) |
| Values | calibrated reflectance; may fall slightly outside [0, 1]
|
The header decodes to 640, 480, 100 and the file size equals 12 + 640 × 480 × 100 × 4 exactly. Big-endian float32 gives physically plausible reflectance with no non-finite values; little-endian gives thousands of NaN.
The two ordering questions were settled by measuring the sample stream directly rather than guessing. Autocorrelation of the raw stream peaks at lag 100 (r = 0.95) — the band count — with harmonics at 200, 300 and 400, which is the signature of band interleaving by pixel. Autocorrelation of a single extracted band plane then peaks at lag 480 (r = 0.99), the image height, against r = 0.43 at lag 640, the width: pixels run down columns, not across rows. Rendering with that ordering produces a sharp clinical image; every other combination produces tiling, striping or noise.
A note on validating this
An earlier version of this README claimed the layout was validated at r = 0.86 against the Suite’s _RGB-Image.png. That was wrong, and worth recording. The figure came from correlating downsampled images, and the reference is dominated by horizontal structure that survives horizontal tiling — so an image tiled four times across still scored 0.86.
The vendor PNG turned out to be unusable as ground truth anyway: it is rendered at a different size, carries a title bar, and is rotated relative to the cube, so even the correct layout correlates with it at roughly zero. The thing that actually settled the format was looking at the image, and then measuring the sample stream’s own periodicity — no reference required.
Getting this wrong is easy to miss, because array() recycles silently: a reader with the wrong ordering still returns a full-size, plausible-looking cube. tivis_read_header() therefore validates the file size against the header, and the tests pin the x/y mapping with an asymmetric feature rather than only round-tripping the writer against the reader — which is what let the earlier error pass a green suite.
Related packages
| Package | Role |
|---|---|
cuvis.r |
Cubert .cu3s via the CUVIS SDK |
hyperspectR |
hsi_cube class, preprocessing, tissue indices |
hyperspectaculR |
Publication-grade visualisation |
Citation
If you use this software, please cite it as:
Heller, R. (2026). tivis.r: Reading Diaspective Vision TIVITA hyperspectral recordings (Version 0.1.0) [Computer software]. Zenodo. https://doi.org/10.5281/zenodo.21889970