


The ZHN Auditor dashboard is the interactive front
end of zhncommandR: it loads a tumour-documentation
workbook, computes the quality, OPS-8-544, OPS-1-941, survival,
oncoprint and cytogenetics views live, and lets an auditor explore and
export them. Everything it shows is computed by the package’s exported
functions — see vignette("figures-and-tables") for the same
outputs in code.
Launching
With no file uploaded the app starts empty; click
Beispieldaten laden to load the bundled synthetic
cohort, or use Kohorten-Excel (.xlsx) hochladen to
analyse your own workbook (canonical sheets Basisdaten,
Komplexe Chemotherapie, Komplexe Diagnostik,
with regex fallbacks). No data is written outside the session.
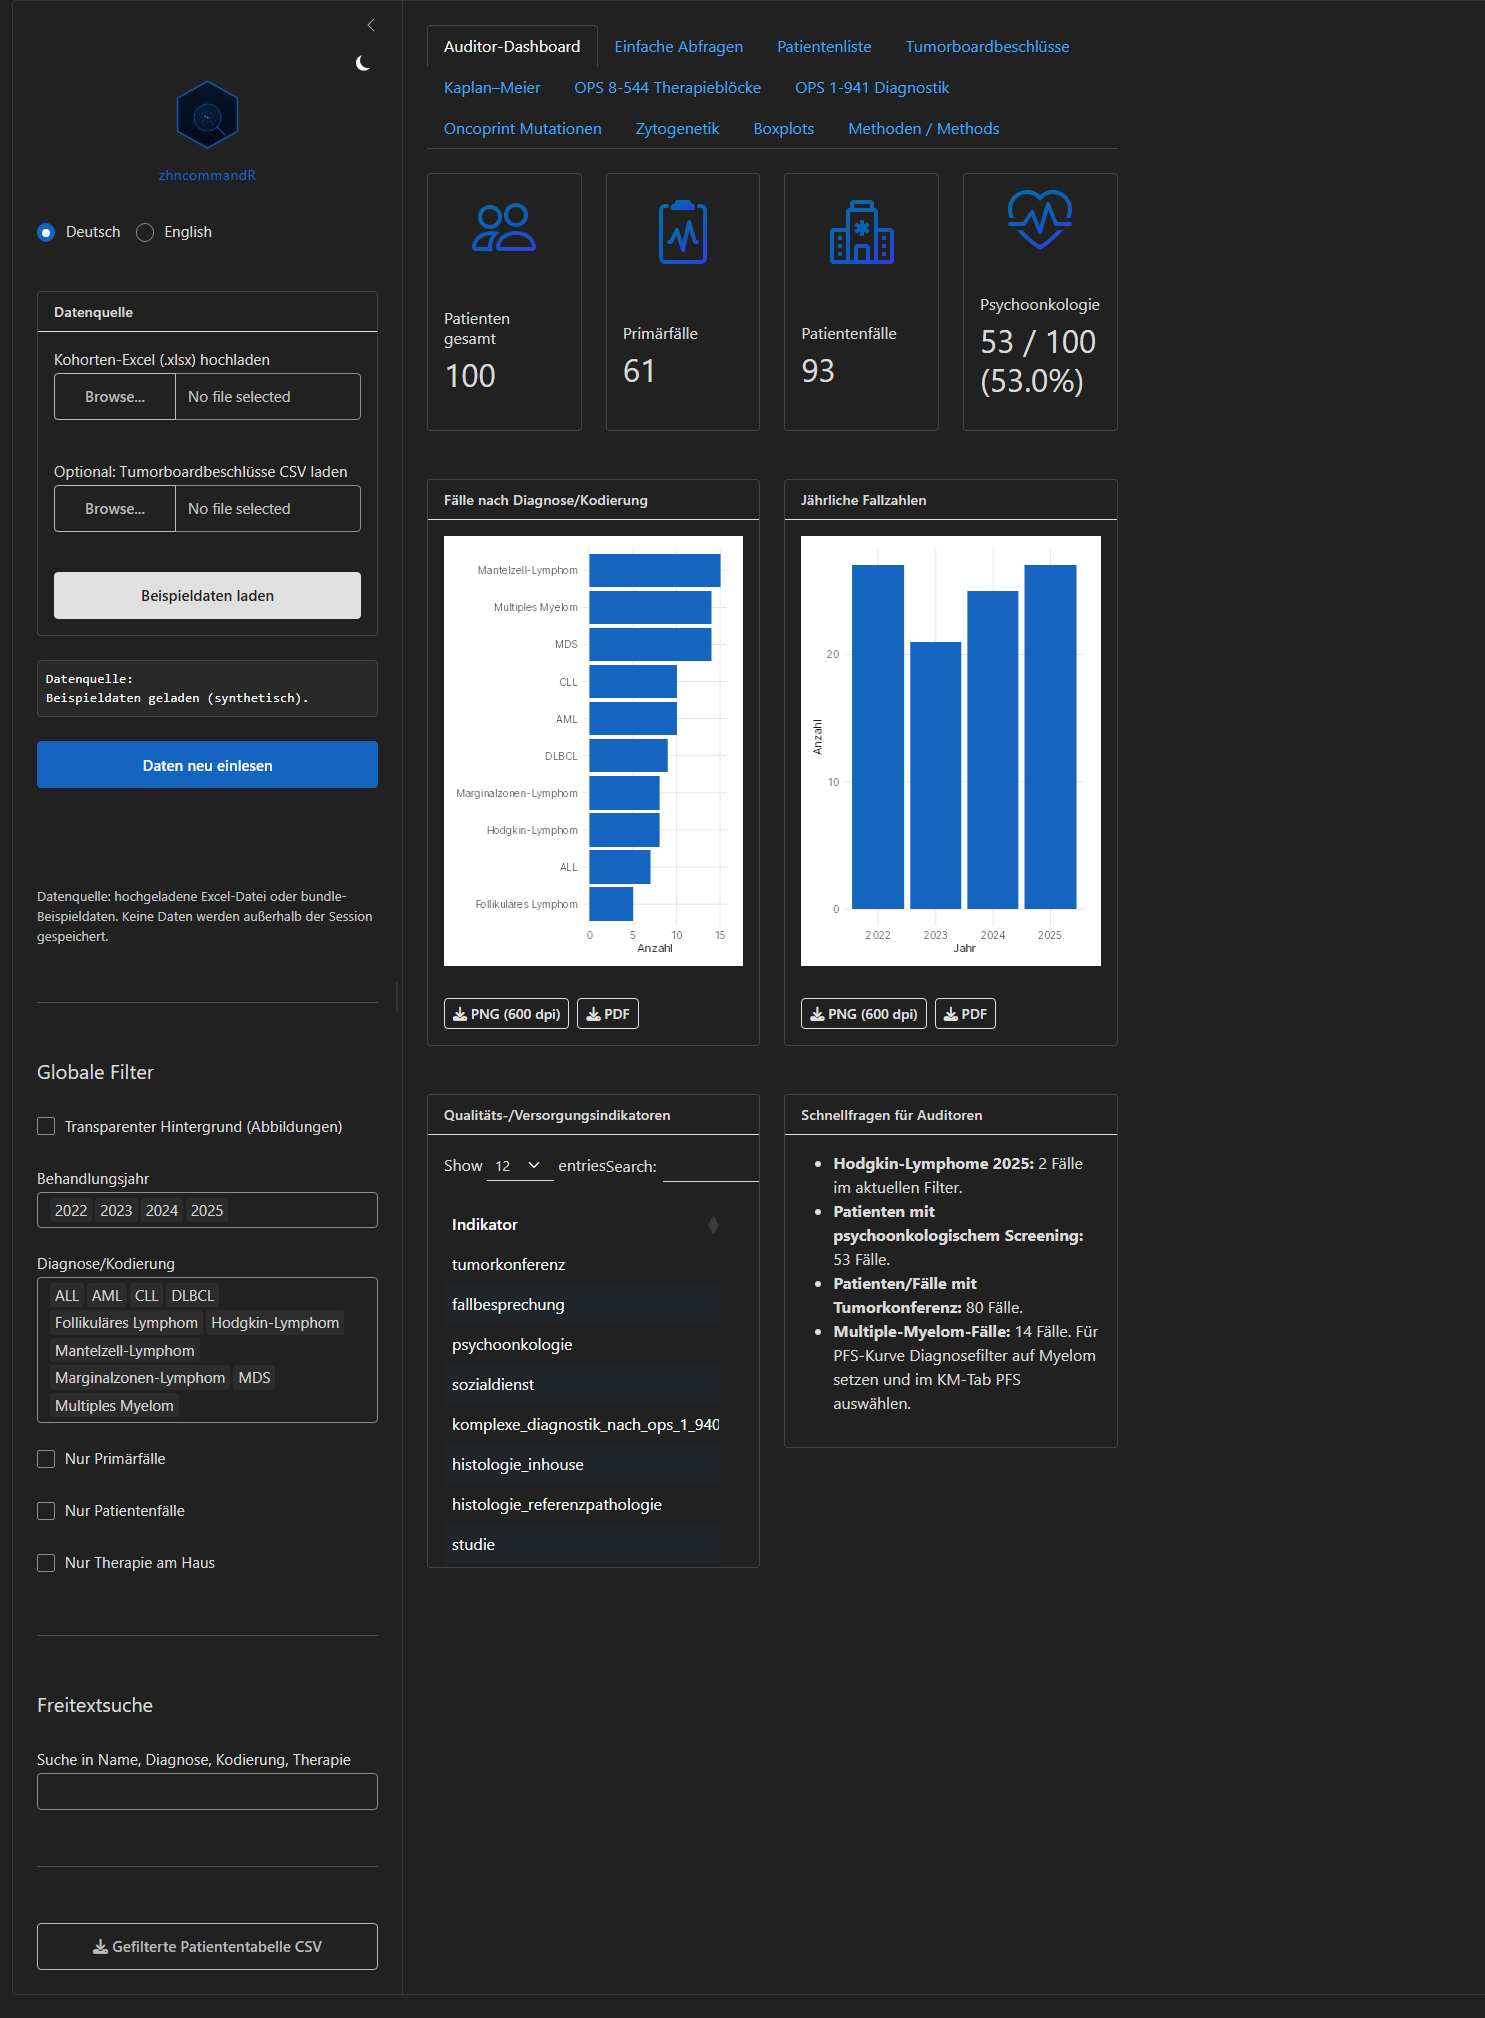
The auditor dashboard on the bundled synthetic cohort.
Layout
- Left sidebar — branding and the light/dark toggle; the data source controls; a global transparent-background switch for the figures; and the global filters (treatment year, entity/coding, primary/patient case, in-house therapy) plus a free-text search that every tab respects.
- Main area — a tab per analysis: Auditor-Dashboard (value boxes, the diagnosis and yearly bar charts, the quality-indicator table and auditor quick-questions), Patientenliste, Tumorboardbeschlüsse, Kaplan-Meier, OPS 8-544 Therapieblöcke, OPS 1-941 Diagnostik, Oncoprint Mutationen, Zytogenetik, Boxplots, and Methoden / Methods.
The interface is bilingual — the Deutsch / English
switch retranslates the UI live (via shiny.i18n).
Figures: transparency and export
Every figure honours the global Transparenter
Hintergrund switch (it drives both the on-screen plot and the
exported file) and carries its own PNG (600 dpi) and
PDF download buttons. PNGs are rendered with
ragg, PDFs are vector with the Inter font embedded —
paper-ready straight from the app.
The Kaplan-Meier tab
The survival tab is fully customizable. It opens on a displayable curve (overall survival, confidence interval, censoring marks and a numbers-at-risk table) and every element is an independent switch, grouped into Daten/Endpunkt, Statistik and Darstellung panels:
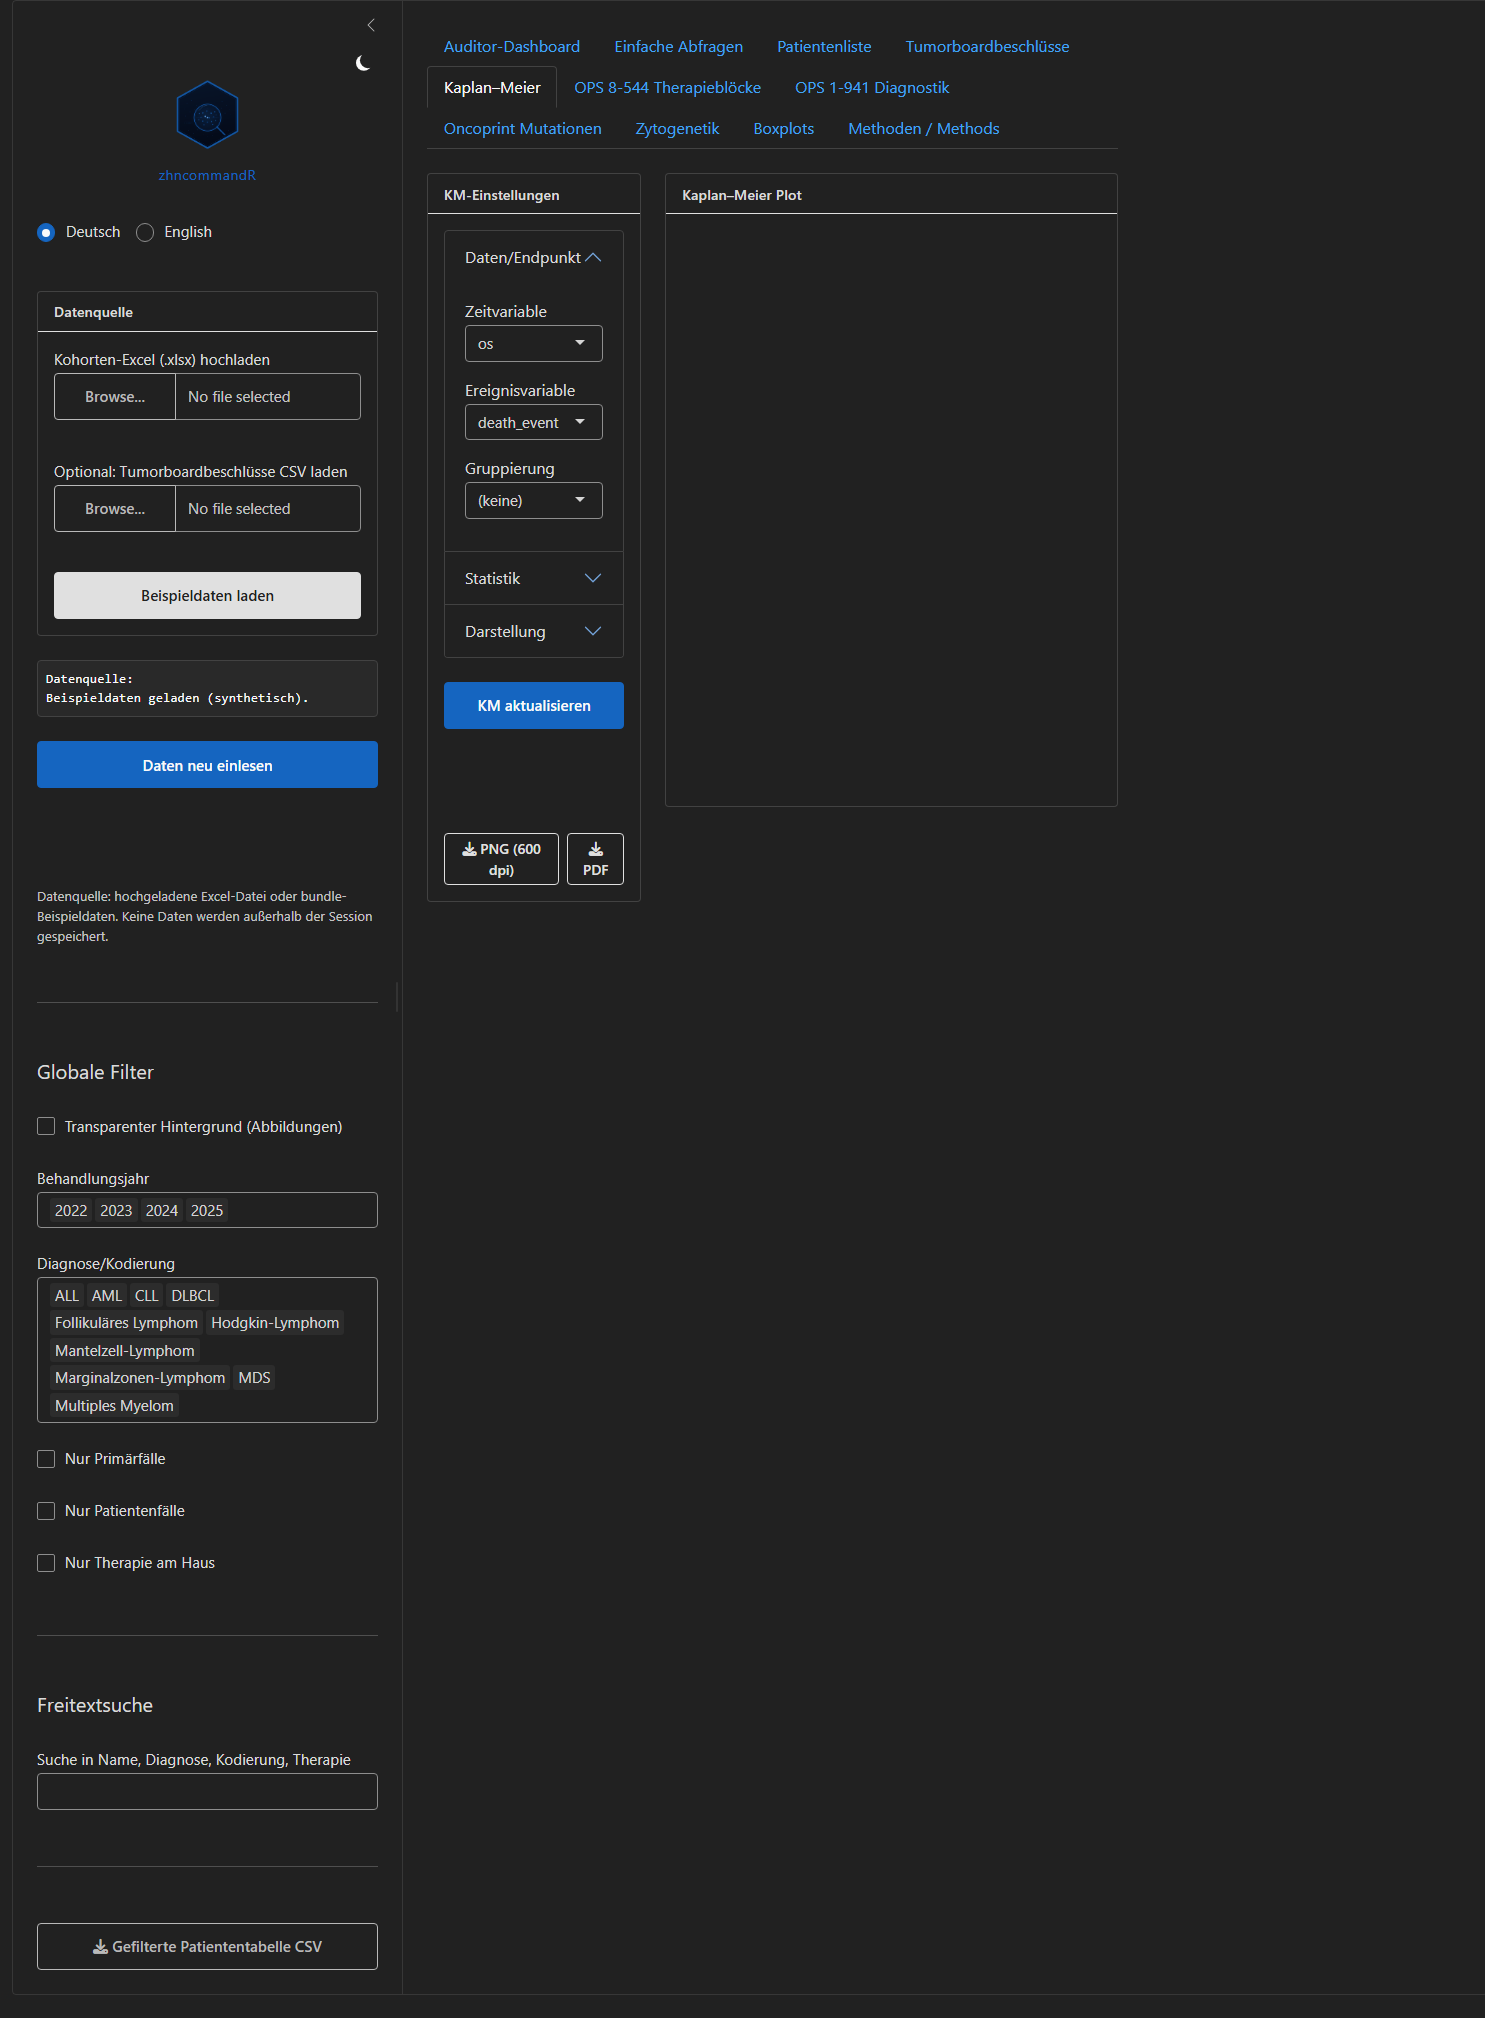
The Kaplan-Meier tab: curve, confidence interval, censoring marks and aligned risk table.
-
Statistics — confidence interval (90/95/99 %,
log-log/log/plain), risk table (numbers at risk / censored / events),
censoring marks, log-rank p-value (enabled with ≥ 2 groups), Cox hazard
ratio with 95 % CI (exactly 2 groups) shown together with a
cox.zphproportional-hazards check and a caution note when the assumption is violated, median-survival reference lines, and pairwise log-rank comparisons with Benjamini-Hochberg correction (> 2 groups, shown as a table). - Appearance — survival / percent / cumulative-incidence scale, x-axis break interval and maximum, legend position, and an editable title, subtitle and caption. The export filename is derived from the title.
The curve and its risk table are rendered with ggsurvfit and share
one x-axis, so time t sits at the same position on the
curve and in the table — in the live view and in the export.
Privacy
The app keeps everything in the session: uploaded files are read into
memory, tumour-board decisions live in a reactiveVal and
are only persisted via an explicit CSV download, and the Hugo Coder
system-font styling makes no external font or analytics calls. The
bundled example is fully synthetic. For the container deployment (Docker
+ Shiny Server behind Caddy/TLS) see the package’s docker/
directory.