
Builds a themed Kaplan-Meier figure with ggsurvfit. Every publication
element is an argument; the same call drives the live app and the PNG/PDF
export. With a risk table the return value is the aligned plot+table
composite (ggsurvfit::ggsurvfit_build() output) so zhn_save_plot() writes
the full figure. This is the one figure that keeps an (editable) title.
Usage
zhn_plot_km(
  data,
  time_col,
  event_col,
  group_col = NULL,
  conf_int = TRUE,
  conf_level = 0.95,
  conf_type = "log-log",
  risktable = TRUE,
  risktable_stats = "n.risk",
  censor_marks = TRUE,
  show_pvalue = TRUE,
  show_hr = FALSE,
  show_median = FALSE,
  y_scale = c("survival", "percent", "cuminc"),
  x_break = NULL,
  x_max = NULL,
  legend_pos = "top",
  title = NULL,
  subtitle = NULL,
  caption = NULL,
  transparent = FALSE
)
Arguments
- data
A data frame / cohort with the time and event columns.
- time_col, event_col
Column names (character) for follow-up time and event; the event is parsed to 0/1 via the package's hardened coercion.
- group_col
Optional grouping column (character), or
NULLfor one overall curve.- conf_int
Logical; show confidence-interval ribbons.
- conf_level
CI level (e.g. 0.90/0.95/0.99).
- conf_type
CI method:
"log-log"(default),"log", or"plain".- risktable
Logical; show the numbers-at-risk table below the plot.
- risktable_stats
Which rows: any of
"n.risk","n.censor","n.event".- censor_marks
Logical; show censoring tick marks.
- show_pvalue
Logical; annotate the log-rank p-value (>= 2 groups).
- show_hr
Logical; annotate the Cox HR with 95% CI (exactly 2 groups), always with a
cox.zphproportional-hazards check and a caution note when violated.- show_median
Logical; draw reference lines at the median survival.
- y_scale
"survival"(0-1),"percent"(0-100), or"cuminc"(1 - S).- x_break
Numeric x-axis break interval, or
NULLfor automatic.- x_max
Numeric x-axis truncation, or
NULLfor full range.- legend_pos
"top","right","bottom", or"none".- title, subtitle, caption
Character or
NULL.- transparent
Logical; transparent background for display/export.
Value
A ggsurvfit/ggplot object; a patchwork composite when
risktable = TRUE. Carries an "n_groups" attribute.
Examples
# \donttest{
if (requireNamespace("ggsurvfit", quietly = TRUE)) {
co <- zhn_read_cohort(zhn_example_path(), verbose = FALSE)
zhn_plot_km(co, "os", "death_event") # default single curve
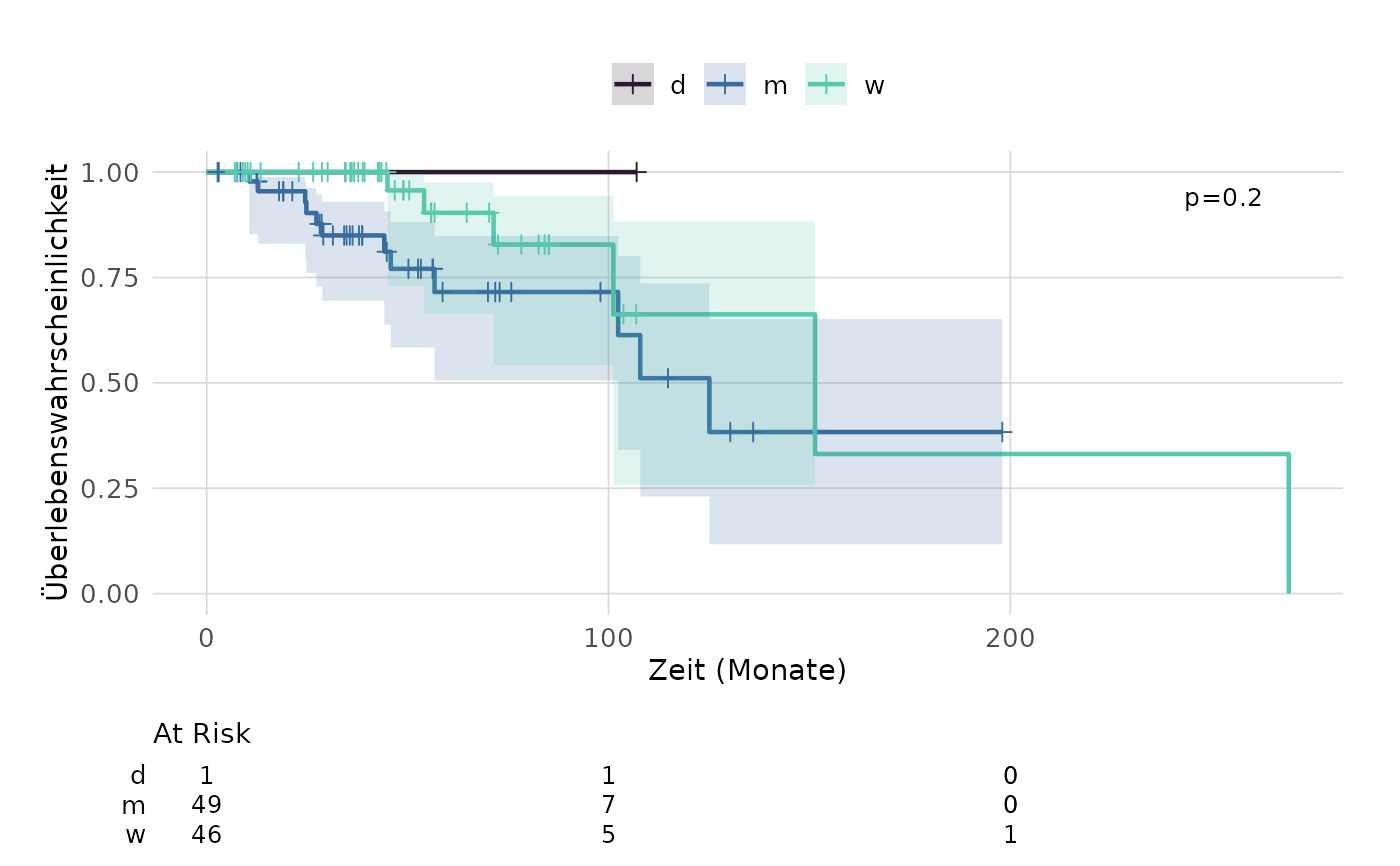
zhn_plot_km(co, "os", "death_event", group_col = "geschlecht",
show_pvalue = TRUE) # grouped + log-rank
}
 # }
# }