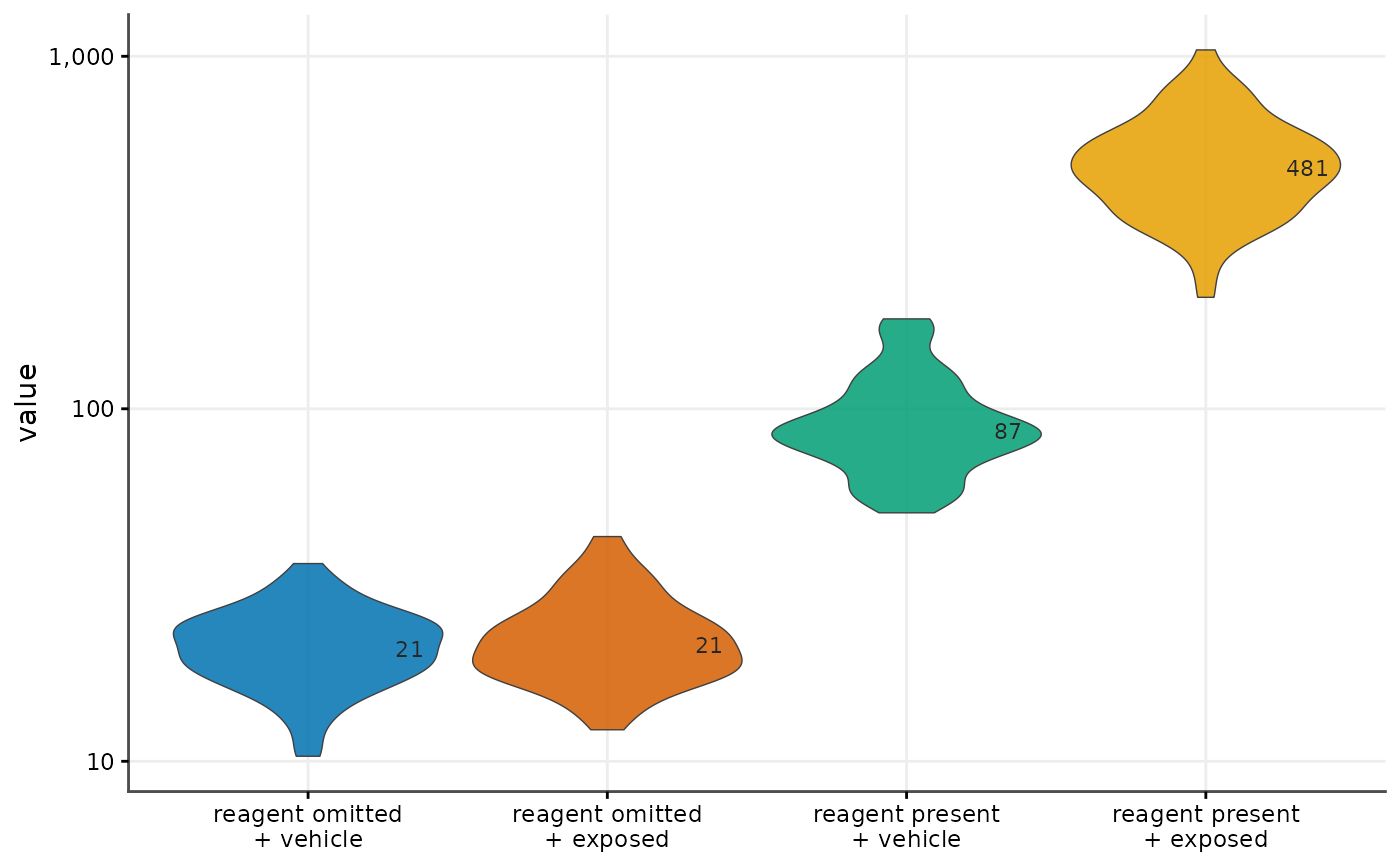
Draws the arms of the specificity control side by side: the assay with the detection reagent present against the same exposure with the reagent omitted. No amount of batch standardisation can show that a readout is reagent-dependent rather than background autofluorescence, which is what makes this the strongest validation a method-establishment result has.
Usage
cr_plot_specificity(
  spec,
  arm = "arm",
  value = NULL,
  arm_levels = NULL,
  colour_by = NULL,
  log_y = TRUE,
  ratio_arms = NULL,
  title = NULL,
  subtitle = NULL,
  x_lab = NA,
  y_lab = NULL
)
Arguments
- spec
Cell-level or per-arm data: a data frame, or a list carrying one in a
specorspecificityelement.- arm
Name of the column identifying the arm (default
"arm").- value
Name of the value column.
NULL(default) auto-detects:median_signalfor a summarised table, otherwisevalue.- arm_levels
Optional character vector fixing the order of the arms.
- colour_by
Column mapped to fill, or
NULLto fill by arm.- log_y
Draw the signal axis on a log scale (default
TRUE).- ratio_arms
Optional length-2 character vector naming the arms whose median ratio is reported in the subtitle, as
c(numerator, denominator). Whenspeccarries asignal_to_backgroundattribute that value is used instead.- title, subtitle, x_lab, y_lab
Plot labels.
NULLuses a computed default;NAomits the label.
Details
Accepts either cell-level data (one row per cell, drawn as violins with the arm medians annotated) or an already-summarised table (one row per arm, drawn as columns).
See also
Other screen figures:
cr_plot_forest(),
cr_plot_qc_gate(),
cr_plot_sample_size(),
cr_plot_screen(),
cr_save_plot()
Examples
set.seed(1)
spec <- data.frame(
  arm = rep(c("reagent omitted\n+ vehicle", "reagent omitted\n+ exposed",
              "reagent present\n+ vehicle", "reagent present\n+ exposed"),
            each = 60),
  value = c(rlnorm(60, 3, 0.3), rlnorm(60, 3.05, 0.3),
            rlnorm(60, 4.5, 0.3), rlnorm(60, 6.2, 0.3))
)
cr_plot_specificity(spec)