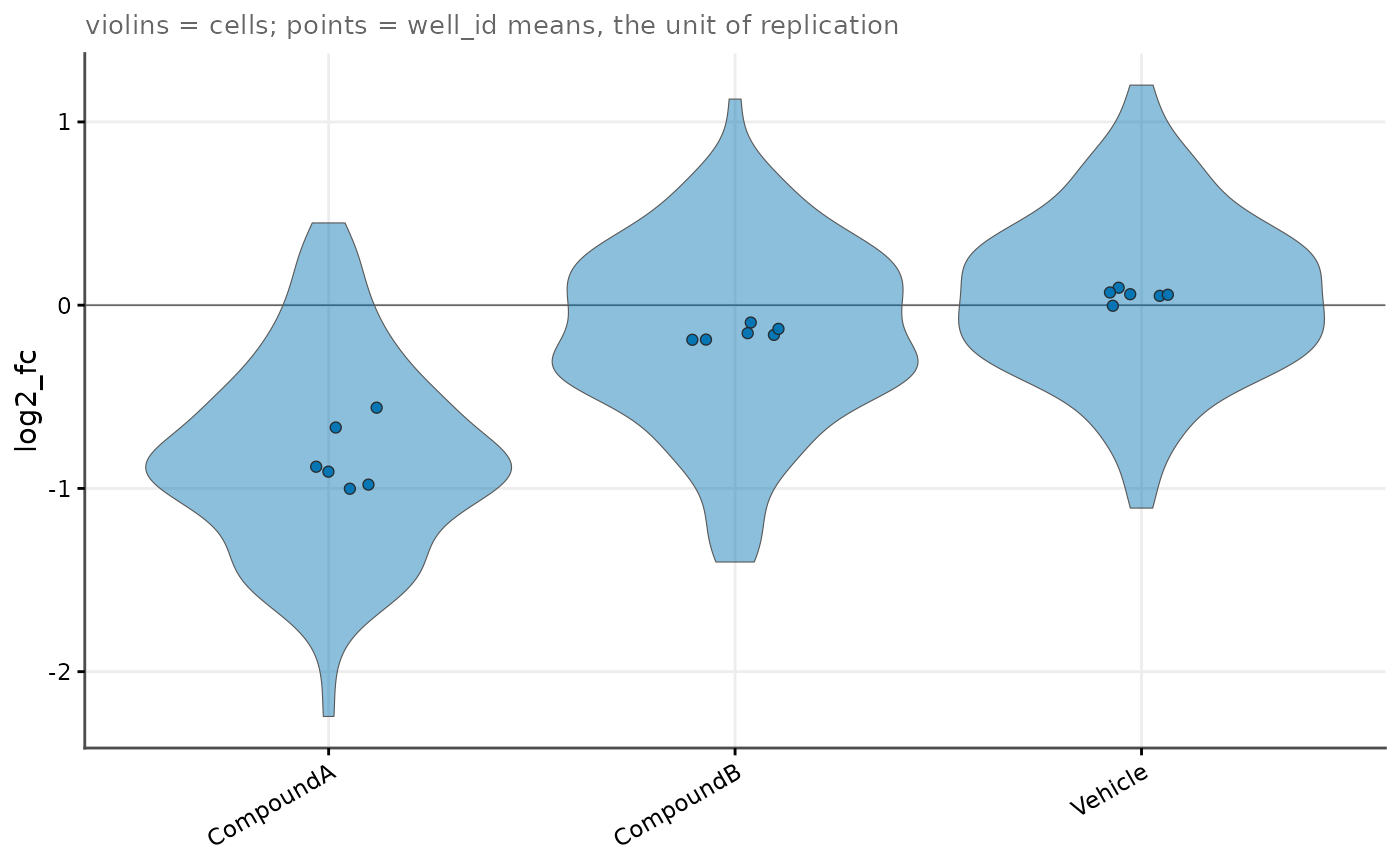
Distribution figure with the unit of replication overlaid
Source:R/plots-screen.R
cr_plot_screen.RdDraws width-scaled violins of the cell-level value for each group, with the per-unit means overplotted as jittered points. Cells are the observations; the unit (well, slide or merged acquisition) is the unit of replication, and drawing both in one panel is what keeps a reader from reading cell counts as replicate counts.
Usage
cr_plot_screen(
  cells,
  value = "log2_fc",
  group_var = "treatment",
  units = NULL,
  unit_value = NULL,
  facet_by = NULL,
  colour_by = NULL,
  reference = 0,
  seed = NULL,
  title = NULL,
  subtitle = NULL,
  x_lab = NA,
  y_lab = NULL
)
Arguments
- cells
Cell-level data: a data frame, or a
cr_experimentwhose cells are joined to its design.- value
Name of the cell-level value column, typically a standardised value such as a log fold change (default
"log2_fc").- group_var
Name of the column defining the x-axis groups (default
"treatment").- units
Unit-level data. Either a data frame of one row per unit, or the name of a column in
cellsidentifying the unit, in which case the per-unit means are computed.NULLdraws the violins alone.- unit_value
Name of the unit-level value column. Defaults to
value.- facet_by
One or two column names to facet on, or
NULL.- colour_by
Column mapped to fill and shape.
NULL(default) draws a single colour, because hue that encodes nothing is decoration.- reference
Horizontal reference line, or
NULLfor none (default0, the null of a log fold change).- seed
Integer seed for the point jitter, so the figure reproduces.
- title, subtitle, x_lab, y_lab
Plot labels.
NULLuses a computed default;NAomits the label.
Details
The point layer is drawn with a fixed jitter seed so the figure is reproducible, and the subtitle states which layer is the unit of replication rather than leaving it to the caption.
See also
cr_plot_forest(), cr_theme(), cr_scale_group()
Other screen figures:
cr_plot_forest(),
cr_plot_qc_gate(),
cr_plot_sample_size(),
cr_plot_specificity(),
cr_save_plot()
Examples
set.seed(1)
cells <- data.frame(
  treatment = rep(c("Vehicle", "CompoundA", "CompoundB"), each = 120),
  well_id = rep(paste0("W", 1:18), each = 20),
  log2_fc = c(rnorm(120, 0, 0.5), rnorm(120, -0.8, 0.5),
              rnorm(120, -0.2, 0.5))
)
cr_plot_screen(cells, group_var = "treatment", units = "well_id", seed = 1)