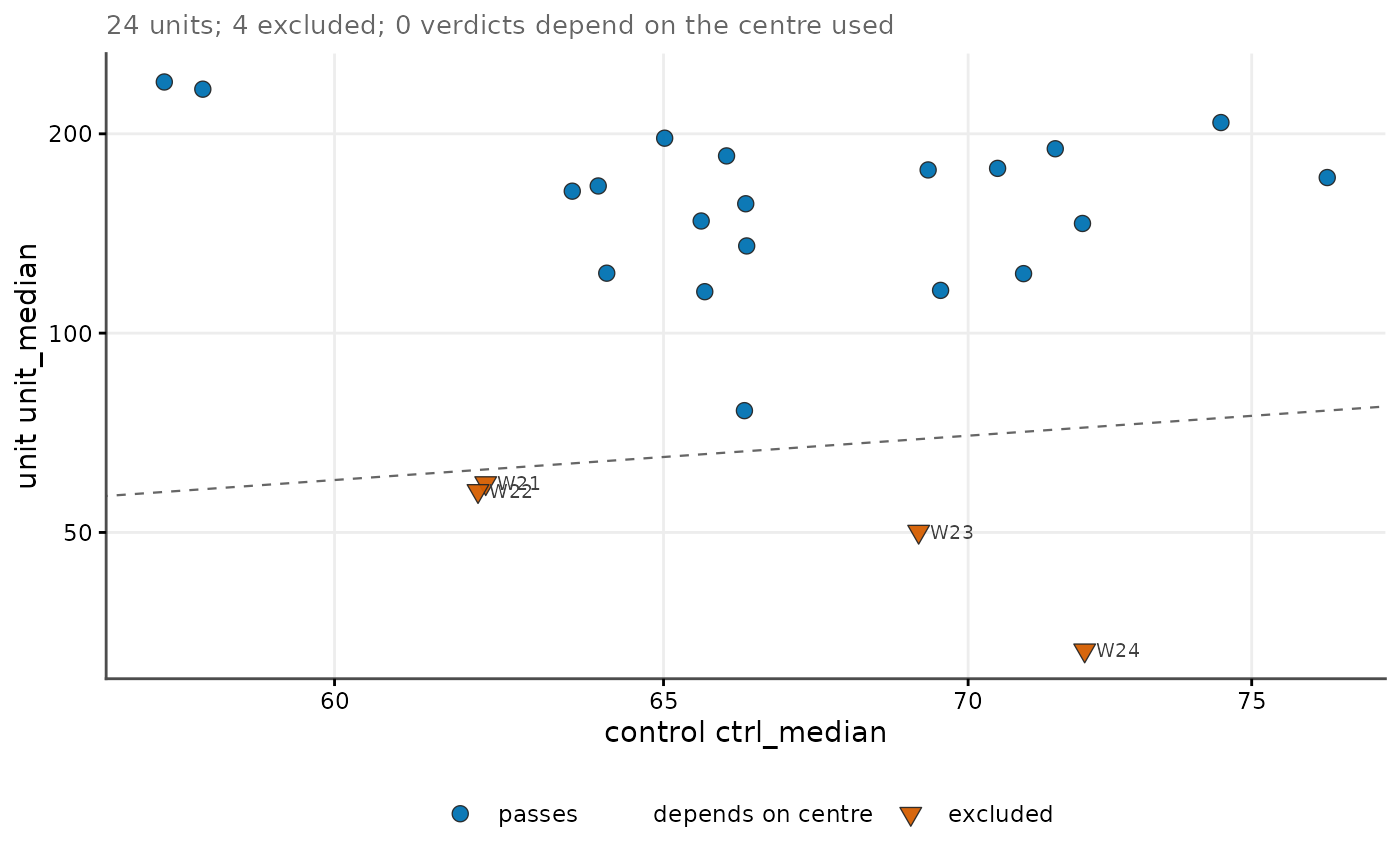
Plots each unit's statistic against the statistic of the control it is
gated on, with the line of equality. Points above the line pass a
"greater" gate; points below it fail and are excluded.
Usage
cr_plot_qc_gate(
  gate,
  statistic = NULL,
  reference = NULL,
  fails_median = NULL,
  fails_mean = NULL,
  direction = c("greater", "less"),
  log_scale = TRUE,
  label = NULL,
  title = NULL,
  subtitle = NULL,
  x_lab = NULL,
  y_lab = NULL
)
Arguments
- gate
A
cr_qc_gateobject, a list carrying aunitsdata frame, or a data frame with one row per unit.- statistic
Name of the unit statistic column.
NULL(default) auto-detects.- reference
Name of the control statistic column.
NULL(default) auto-detects.- fails_median, fails_mean
Names of the logical verdict columns under the two centres.
NULL(default) auto-detects; when neither is present the verdict is computed fromstatistic,referenceanddirection.- direction
"greater"(default) when a unit must exceed its control to pass,"less"when it must fall below.- log_scale
Draw both axes on a log scale when every value is positive (default
TRUE).- label
Optional column whose values annotate the failing units.
- title, subtitle, x_lab, y_lab
Plot labels.
NULLuses a computed default;NAomits the label.
Details
Where the input carries a verdict under both centres, median and mean, the units whose verdict depends on which centre was used are drawn as their own class. That distinction matters because a right-skewed signal has a mean above its median, so gating a raw median against a control mean is silently stricter than the stated rule, and a gate that can only drop low units manufactures apparent effects when it is too strict.
See also
cr_plot_qc() for the distribution dashboard.
Other screen figures:
cr_plot_forest(),
cr_plot_sample_size(),
cr_plot_screen(),
cr_plot_specificity(),
cr_save_plot()