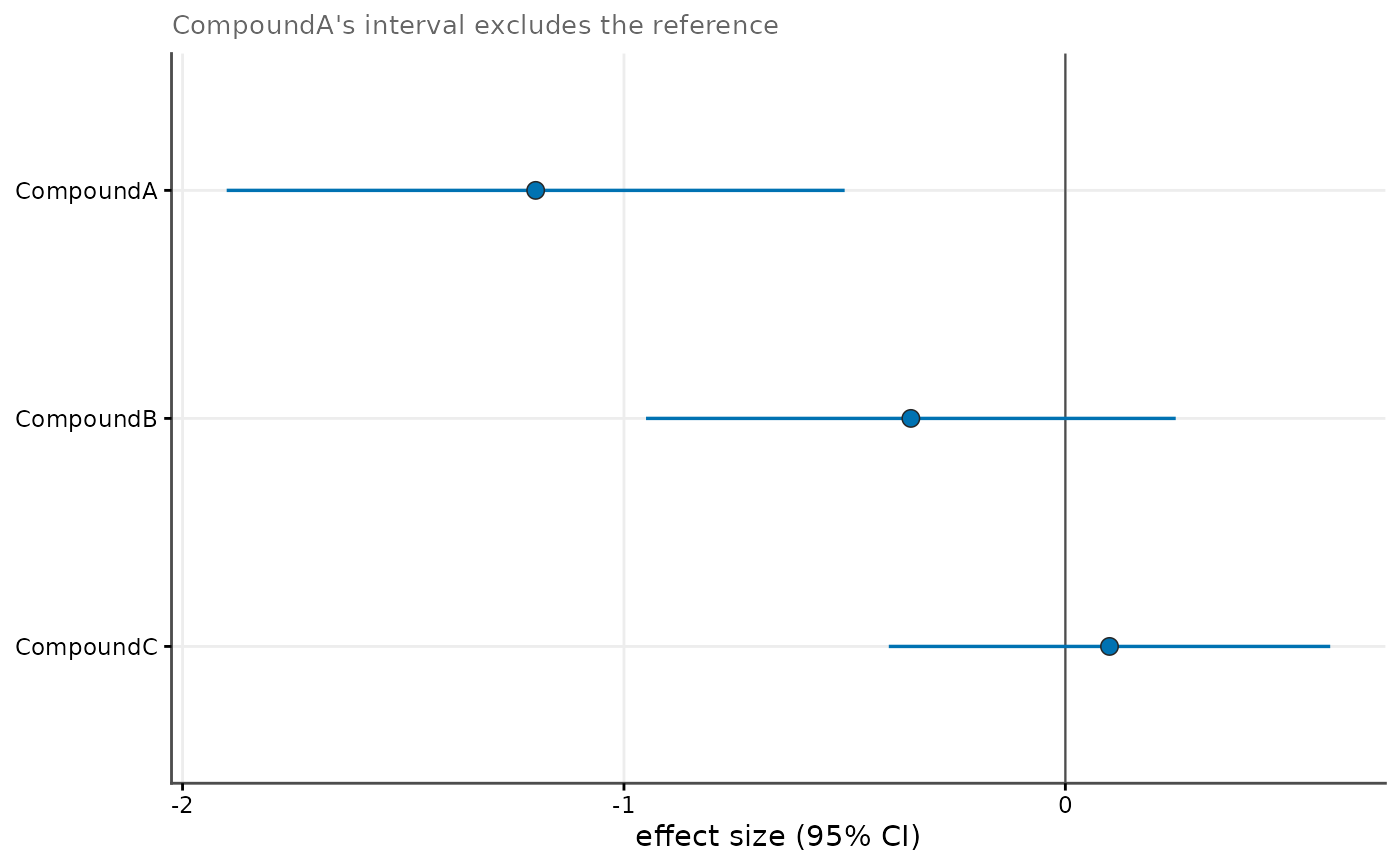
Draws one row per contrast: the point estimate with its confidence interval, a reference line at the null, and the rows ordered by the estimate rather than alphabetically, so the ordering is computed from the data and cannot go stale.
Usage
cr_plot_forest(
  effects,
  estimate = "estimate",
  ci_low = "ci_low",
  ci_high = "ci_high",
  label = NULL,
  facet_by = NULL,
  colour_by = NULL,
  method = "cohens_d",
  reference = 0,
  order_by_estimate = TRUE,
  descending = FALSE,
  title = NULL,
  subtitle = NULL,
  x_lab = NULL,
  y_lab = NA
)
Arguments
- effects
A data frame of effect sizes (for example the output of an effect-size grid), a
cr_result, or a list ofcr_results.- estimate, ci_low, ci_high
Names of the estimate and interval columns.
- label
Name of the column identifying each row.
NULL(default) picks the first ofgroup,compound,treatment,contrast,labelortermthat is present.- facet_by
One or two column names to facet on, or
NULL.- colour_by
Column mapped to colour, fill and shape, or
NULL.- method
Effect-size method to keep when
effectscarries amethodcolumn with several methods (default"cohens_d").- reference
Position of the null reference line (default
0).- order_by_estimate
Order rows by the estimate (default
TRUE).FALSEkeeps the order oflabel.- descending
Order largest estimate at the top (default
FALSE, which puts the most negative - typically the strongest protection - at the top).- title, subtitle, x_lab, y_lab
Plot labels.
NULLuses a computed default;NAomits the label.
Details
The default subtitle states which intervals exclude the reference. It is computed from the interval bounds for the same reason: the equivalent sentence written by hand in the source pipeline stopped matching the data the first time the data changed.
See also
cr_plot_screen(), cr_plot_effect_sizes()
Other screen figures:
cr_plot_qc_gate(),
cr_plot_sample_size(),
cr_plot_screen(),
cr_plot_specificity(),
cr_save_plot()
Examples
effects <- data.frame(
  group = c("CompoundA", "CompoundB", "CompoundC"),
  estimate = c(-1.2, -0.35, 0.1),
  ci_low = c(-1.9, -0.95, -0.4),
  ci_high = c(-0.5, 0.25, 0.6)
)
cr_plot_forest(effects)