library(tidyverse)
library(broom)
set.seed(42)
theme_set(theme_minimal(base_size = 12))Week 4, Session 4 — Decision curves, NRI, IDI
Course 2 — #courses
Note
Workflow lab: Goal → Approach → Execution → Check → Report.
Learning objectives
- Compute net benefit and draw a decision-curve plot for two competing risk models.
- Compute category-free NRI and IDI and read what each adds beyond ROC/AUC.
- Decide which of the three to report in which setting.
Prerequisites
Course 2 Week 3 Session 5 (calibration, discrimination) and a working logistic-regression fit.
Background
A prediction model is useful when its decisions, weighted by clinical consequence, beat any alternative policy. Decision-curve analysis makes that comparison explicit: across a range of threshold probabilities, it plots net benefit — true positives minus false positives, weighted by the threshold — against the “treat all” and “treat none” default policies. A model whose decision curve dominates the defaults across a clinically plausible range of thresholds is providing decision value.
The net reclassification improvement (NRI) and integrated discrimination improvement (IDI) are category-free alternatives to comparing AUCs. NRI summarises how well the new model moves events upwards and non-events downwards in risk; IDI summarises the mean change in predicted probabilities. Both are noisy in small samples and both are prone to optimistic interpretation, so report them alongside, not instead of, the decision curve.
Setup
1. Goal
Compare a baseline logistic model with a model that adds a new marker, using decision curves, NRI, and IDI.
2. Approach
n <- 800
x1 <- rnorm(n)
x2 <- rnorm(n) + 0.3 * x1
lp <- -1 + 0.9 * x1 + 0.6 * x2
y  <- rbinom(n, 1, plogis(lp))
df <- tibble(y = y, x1 = x1, x2 = x2)

base_fit <- glm(y ~ x1,       data = df, family = binomial)
new_fit  <- glm(y ~ x1 + x2,  data = df, family = binomial)
df <- df |>
  mutate(p_base = predict(base_fit, type = "response"),
         p_new  = predict(new_fit,  type = "response"))
3. Execution — decision curve (hand-coded)
net_benefit <- function(y, p, thr) {
  n <- length(y)
  pred_pos <- p >= thr
  tp <- sum(pred_pos &  y == 1)
  fp <- sum(pred_pos &  y == 0)
  tp / n - fp / n * (thr / (1 - thr))
}

thresholds <- seq(0.05, 0.6, by = 0.01)
dc <- tibble(
  threshold    = thresholds,
  base_model   = sapply(thresholds, \(t) net_benefit(df$y, df$p_base, t)),
  new_model    = sapply(thresholds, \(t) net_benefit(df$y, df$p_new,  t)),
  treat_all    = sapply(thresholds, \(t)
                         mean(df$y) - (1 - mean(df$y)) * t / (1 - t)),
  treat_none   = 0
) |>
pivot_longer(-threshold, names_to = "strategy", values_to = "net_benefit")ggplot(dc, aes(threshold, net_benefit, colour = strategy)) +
geom_line(linewidth = 0.8) +
scale_y_continuous(limits = c(-0.05, max(dc$net_benefit))) +
labs(x = "Threshold probability", y = "Net benefit",
colour = NULL)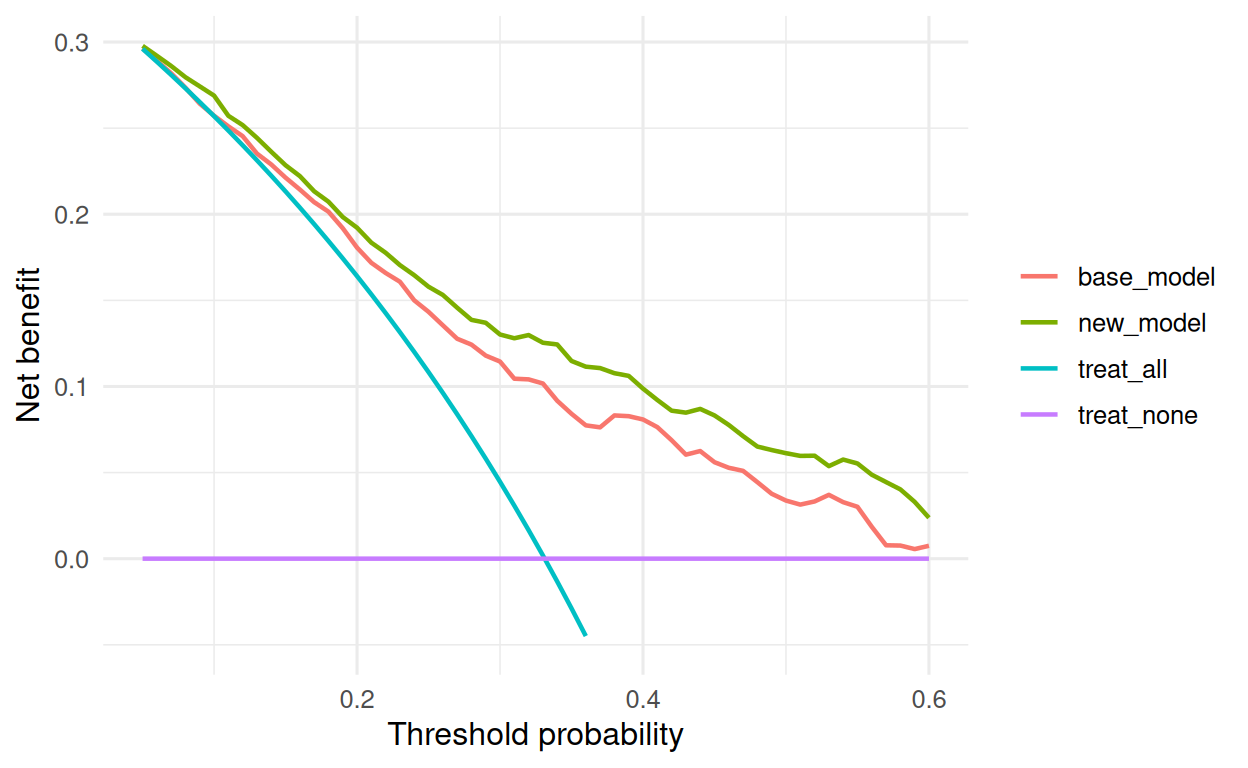
4. Check — NRI and IDI
nri <- function(y, p_old, p_new) {
  up   <- mean((p_new > p_old)[y == 1]) - mean((p_new < p_old)[y == 1])
  down <- mean((p_new < p_old)[y == 0]) - mean((p_new > p_old)[y == 0])
  c(events = up, non_events = down, overall = up + down)
}

idi <- function(y, p_old, p_new) {
  ev <- mean((p_new - p_old)[y == 1])
  ne <- mean((p_old - p_new)[y == 0])
  c(events = ev, non_events = ne, overall = ev + ne)
}

nri(df$y, df$p_base, df$p_new)
events non_events overall
0.2452830 0.2373832 0.4826662 idi(df$y, df$p_base, df$p_new) events non_events overall
0.04479202 0.02218670 0.06697872 5. Report
Adding the new marker to a baseline logistic model yielded higher net benefit than the baseline across clinically plausible threshold probabilities. The category-free NRI was positive for events and non-events; the IDI was also positive overall. Absolute magnitudes should be interpreted alongside the decision curve, not in isolation.
Reviewers increasingly expect decision curves. NRI alone has been criticised for optimism under misspecification — do not rely on it.
Common pitfalls
- Reporting NRI without an interval or decision-curve context.
- Choosing the threshold range post-hoc to maximise apparent gain.
- Forgetting that decision curves assume the cost/benefit ratio implied by the threshold is clinically reasonable.
Further reading
- Vickers AJ, Elkin EB. (2006). Decision curve analysis: a novel method for evaluating prediction models. Medical Decision Making.
- Pencina MJ et al. (2008). Evaluating the added predictive ability of a new marker.
Session info
sessionInfo()R version 4.5.2 (2025-10-31 ucrt)
Platform: x86_64-w64-mingw32/x64
Running under: Windows 11 x64 (build 26200)
Matrix products: default
LAPACK version 3.12.1
locale:
[1] LC_COLLATE=English_Germany.utf8 LC_CTYPE=English_Germany.utf8
[3] LC_MONETARY=English_Germany.utf8 LC_NUMERIC=C
[5] LC_TIME=English_Germany.utf8
time zone: Europe/Berlin
tzcode source: internal
attached base packages:
[1] stats graphics grDevices utils datasets methods base
other attached packages:
[1] broom_1.0.12 lubridate_1.9.5 forcats_1.0.1 stringr_1.6.0
[5] dplyr_1.2.1 purrr_1.2.2 readr_2.2.0 tidyr_1.3.2
[9] tibble_3.3.1 ggplot2_4.0.3 tidyverse_2.0.0
loaded via a namespace (and not attached):
[1] gtable_0.3.6 jsonlite_2.0.0 compiler_4.5.2 tidyselect_1.2.1
[5] scales_1.4.0 yaml_2.3.12 fastmap_1.2.0 R6_2.6.1
[9] labeling_0.4.3 generics_0.1.4 knitr_1.51 backports_1.5.1
[13] htmlwidgets_1.6.4 pillar_1.11.1 RColorBrewer_1.1-3 tzdb_0.5.0
[17] rlang_1.2.0 stringi_1.8.7 xfun_0.57 S7_0.2.2
[21] otel_0.2.0 timechange_0.4.0 cli_3.6.6 withr_3.0.2
[25] magrittr_2.0.4 digest_0.6.39 grid_4.5.2 hms_1.1.4
[29] lifecycle_1.0.5 vctrs_0.7.3 evaluate_1.0.5 glue_1.8.1
[33] farver_2.1.2 rmarkdown_2.31 tools_4.5.2 pkgconfig_2.0.3
[37] htmltools_0.5.9