library(tidyverse)
set.seed(42)
theme_set(theme_minimal(base_size = 12))Week 1, Session 1 — Observational designs and STROBE
Course 3 — #courses
Note
Workflow lab using the variant template: Goal → Approach → Execution → Check → Report.
Learning objectives
- Distinguish cohort, case-control, and cross-sectional designs and say when each is the right tool.
- Simulate a source population and draw both a cohort sample and a cumulative case-control sample from it.
- Map a study report to the STROBE checklist.
Prerequisites
Course 1 (inference) and Course 2 (regression). Familiarity with tibbles and glm().
Background
Observational designs differ primarily in how participants enter the study and when the outcome is measured relative to the exposure. In a cohort we sample on exposure and wait; in a case-control we sample on the outcome and look back; in a cross-sectional we sample once and measure everything together. The choice is driven by how common the outcome is, how long it takes to develop, and how easy the exposure is to measure retrospectively.
STROBE (Strengthening the Reporting of Observational Studies in Epidemiology) is the reporting checklist that keeps observational papers honest. It has 22 items covering title and abstract, introduction, methods, results, and discussion, with specific branches for the three main designs. You do not need to memorise it; you need to know that reviewers will check it.
This example samples controls from people without the outcome at the end of follow-up. It is cumulative case-control sampling: logistic slopes estimate the cohort odds ratios under the stated sampling design. A rare outcome is needed only if interpreting those odds ratios as approximate risk ratios. Risk-set nested case-control sampling is a different design: controls are sampled from people at risk at each event time, and its analysis must respect those matched risk sets. No risk-set sampling is implemented in this lab.
Setup
1. Goal
Simulate a source population, carve a cohort study and a cumulative case-control study out of it, and compare the exposure–outcome association recovered by each.
2. Approach
We generate a population of 5000 people with a binary exposure and a binary outcome whose probability depends on exposure and a confounder (age). We then (a) analyse the full cohort and (b) draw a case-control sample with four controls per case.
n_pop <- 5000
pop <- tibble(
  id       = seq_len(n_pop),
  age      = rnorm(n_pop, 55, 10),
  exposure = rbinom(n_pop, 1, 0.30)
)
# outcome depends on exposure (log OR ~ 0.8) and age
lp <- -4 + 0.8 * pop$exposure + 0.04 * (pop$age - 55)
pop <- pop |>
  mutate(prob = plogis(lp),
         outcome = rbinom(n_pop, 1, prob))
pop |>
count(exposure, outcome) |>
mutate(exposure = factor(exposure, labels = c("unexposed", "exposed")),
outcome = factor(outcome, labels = c("no", "yes"))) |>
ggplot(aes(exposure, n, fill = outcome)) +
geom_col(position = "dodge", alpha = 0.8) +
labs(x = NULL, y = "Count", fill = "Outcome")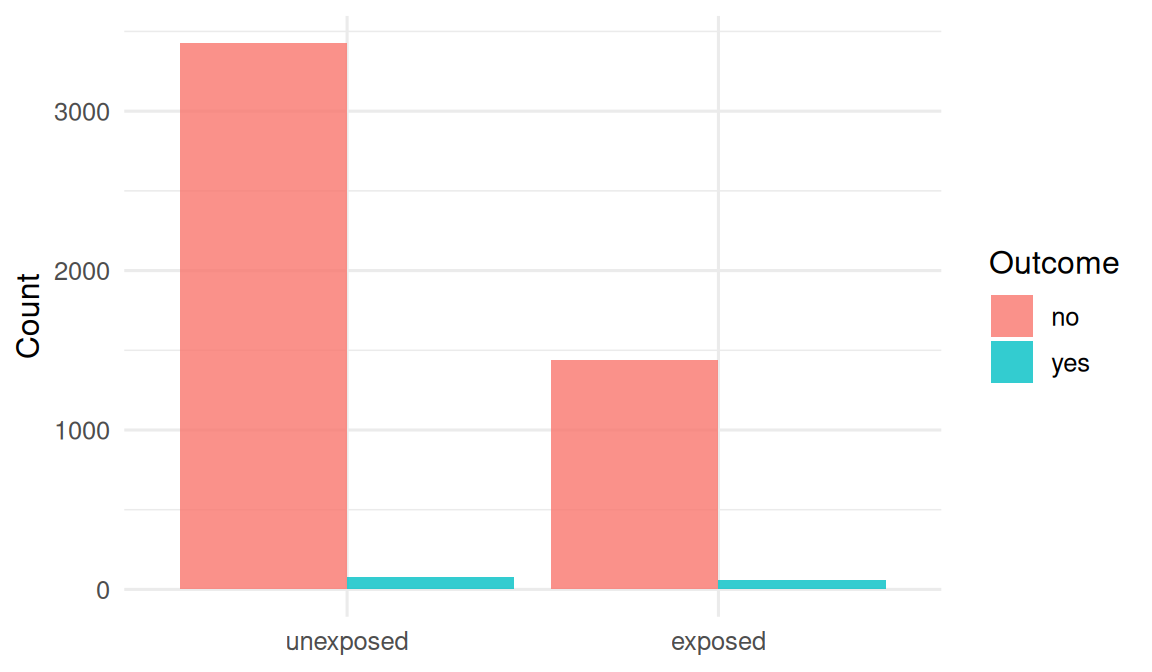
3. Execution
# Cohort analysis on full population
fit_cohort <- glm(outcome ~ exposure + age, data = pop, family = binomial)
coef_cohort <- broom::tidy(fit_cohort, conf.int = TRUE, exponentiate = TRUE)
coef_cohort
# A tibble: 3 × 7
term estimate std.error statistic p.value conf.low conf.high
<chr> <dbl> <dbl> <dbl> <dbl> <dbl> <dbl>
1 (Intercept) 0.00361 0.512 -11.0 4.75e-28 0.00130 0.00972
2 exposure 1.92 0.174 3.75 1.74e- 4 1.36 2.71
3 age 1.03 0.00863 3.74 1.87e- 4 1.02 1.05 # Nested case-control: all cases, 4 controls per case
cases <- pop |> filter(outcome == 1)
controls <- pop |>
filter(outcome == 0) |>
slice_sample(n = 4 * nrow(cases))
cc <- bind_rows(cases, controls)
fit_cc <- glm(outcome ~ exposure + age, data = cc, family = binomial)
coef_cc <- broom::tidy(fit_cc, conf.int = TRUE, exponentiate = TRUE)
coef_cc# A tibble: 3 × 7
term estimate std.error statistic p.value conf.low conf.high
<chr> <dbl> <dbl> <dbl> <dbl> <dbl> <dbl>
1 (Intercept) 0.0347 0.565 -5.95 0.00000000263 0.0112 0.103
2 exposure 2.10 0.197 3.76 0.000168 1.43 3.09
3 age 1.03 0.00954 3.16 0.00156 1.01 1.05 4. Check
The exposure odds ratio from the nested case-control should be close to that from the cohort, because the outcome is uncommon. Precision is worse in the case-control sample but the point estimate is not biased by the sampling scheme.
bind_rows(
  cohort = coef_cohort |> filter(term == "exposure"),
  cc    = coef_cc    |> filter(term == "exposure"),
  .id = "design"
) |>
  select(design, estimate, conf.low, conf.high)
# A tibble: 2 × 4
design estimate conf.low conf.high
<chr> <dbl> <dbl> <dbl>
1 cohort 1.92 1.36 2.71
2 cc 2.10 1.43 3.095. Report
In a simulated source population of 5000 adults, exposure was associated with the outcome with an adjusted odds ratio of 1.92 (95% CI: 1.36 to 2.71) in a full-cohort analysis, and 2.1 (95% CI: 1.43 to 3.09) in a 1:4 nested case-control sample.
STROBE in one paragraph
Report the sampling frame, the eligibility criteria, the exposure and outcome definitions, how confounders were chosen and handled, whatever you did about missing data, and a flow diagram of who was included, excluded, and lost. If you can do those six things clearly, you have answered most of the STROBE items for free.
The point of this lab is that the design choice is not about the model — it is about who gets measured. Reinforce that during the slides.
Common pitfalls
- Treating a cross-sectional association as evidence of a causal effect when temporality is unknown.
- Reporting an odds ratio as a risk ratio when the outcome is common.
- Drawing controls from a different population than the cases.
- Skipping a flow diagram in an observational paper.
Further reading
- von Elm E et al. (2007), The STROBE Statement.
- Rothman KJ, Greenland S, Lash TL. Modern Epidemiology, ch. 6–8.
- Pearce N (2016), Analysis of matched case-control studies, BMJ.
Session info
sessionInfo()R version 4.6.1 (2026-06-24)
Platform: x86_64-pc-linux-gnu
Running under: Ubuntu 26.04.1 LTS
Matrix products: default
BLAS: /usr/lib/x86_64-linux-gnu/openblas-pthread/libblas.so.3
LAPACK: /usr/lib/x86_64-linux-gnu/openblas-pthread/libopenblasp-r0.3.32.so; LAPACK version 3.12.0
locale:
[1] LC_CTYPE=C.UTF-8 LC_NUMERIC=C LC_TIME=C.UTF-8
[4] LC_COLLATE=C.UTF-8 LC_MONETARY=C.UTF-8 LC_MESSAGES=C.UTF-8
[7] LC_PAPER=C.UTF-8 LC_NAME=C LC_ADDRESS=C
[10] LC_TELEPHONE=C LC_MEASUREMENT=C.UTF-8 LC_IDENTIFICATION=C
time zone: UTC
tzcode source: system (glibc)
attached base packages:
[1] stats graphics grDevices datasets utils methods base
other attached packages:
[1] lubridate_1.9.5 forcats_1.0.1 stringr_1.6.0 dplyr_1.2.1
[5] purrr_1.2.2 readr_2.2.0 tidyr_1.3.2 tibble_3.3.1
[9] ggplot2_4.0.3 tidyverse_2.0.0
loaded via a namespace (and not attached):
[1] gtable_0.3.6 jsonlite_2.0.0 compiler_4.6.1 renv_1.3.1
[5] tidyselect_1.2.1 scales_1.4.0 yaml_2.3.12 fastmap_1.2.0
[9] R6_2.6.1 labeling_0.4.3 generics_0.1.4 knitr_1.52
[13] backports_1.5.1 htmlwidgets_1.6.4 tzdb_0.5.0 pillar_1.11.1
[17] RColorBrewer_1.1-3 rlang_1.3.0 utf8_1.2.6 broom_1.0.13
[21] stringi_1.8.9 xfun_0.62 S7_0.2.2 otel_0.2.0
[25] timechange_0.4.0 cli_3.6.6 withr_3.0.3 magrittr_2.0.5
[29] digest_0.6.39 grid_4.6.1 hms_1.1.4 lifecycle_1.0.5
[33] vctrs_0.7.3 evaluate_1.0.5 glue_1.8.1 farver_2.1.2
[37] rmarkdown_2.32 tools_4.6.1 pkgconfig_2.0.3 htmltools_0.5.9