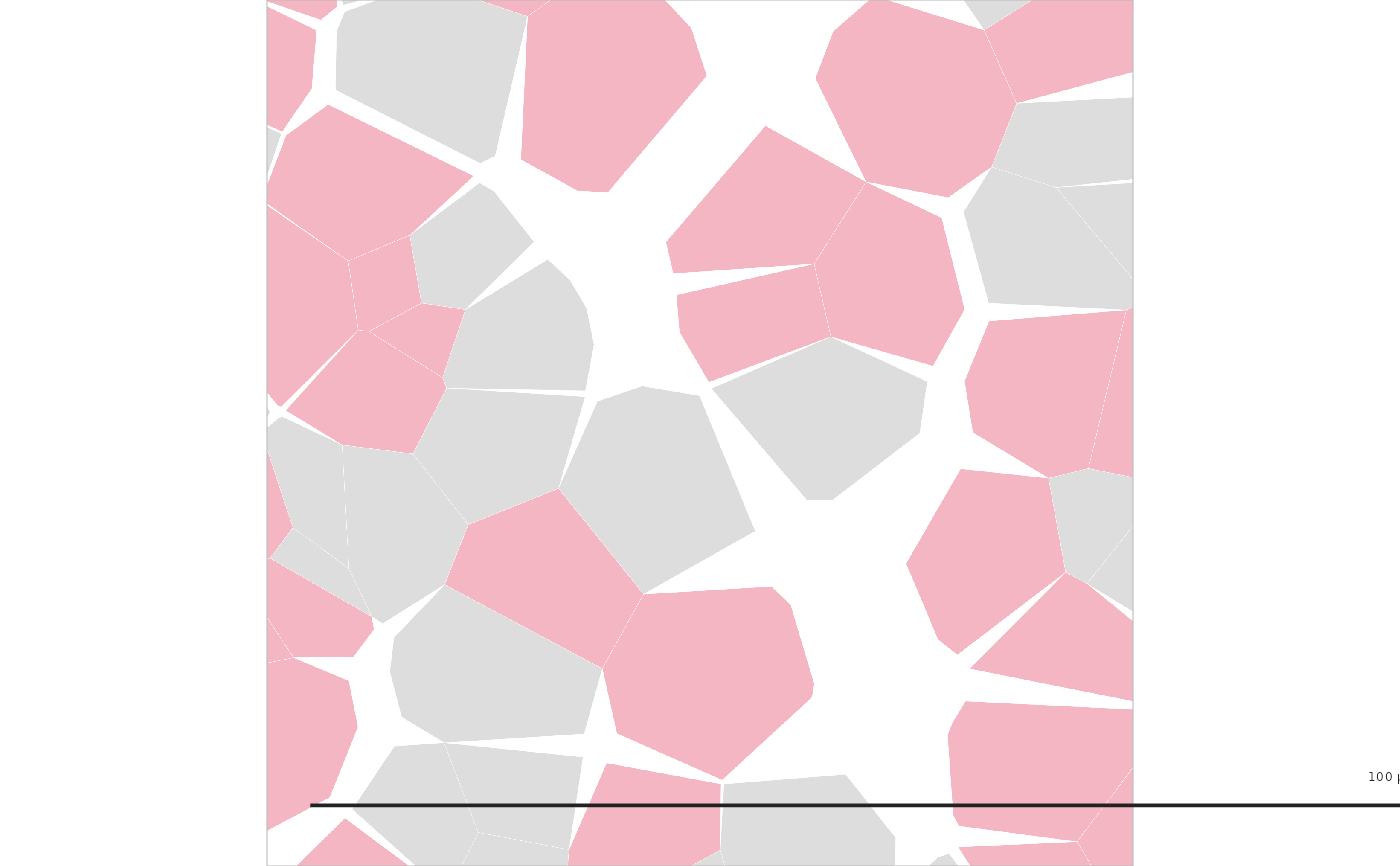
Draws Voronoi territories from TerritoryTiles() filled by class, with
thin white borders, a frame and a scale bar; boxes mark sub-fields.
Usage
PlotTerritories(
  data,
  colours,
  border_colour = "white",
  border_width = 0.12,
  scale_bar = list(length = 100, label = "100 um", y = 0.07, linewidth = 1.4, size = 4.8),
  frame = TRUE,
  frame_colour = "frame",
  frame_width = NULL,
  boxes = NULL,
  box_colour = "ink",
  box_width = 0.9,
  box_size = NULL,
  title = NULL,
  title_size = 5.6,
  style = ManuscriptStyle()
)
Arguments
- data
A
TerritoryTiles()result.- colours
Named colours by class.
- border_colour, border_width
Tile border colour and width (points).
- scale_bar, frame, frame_colour, frame_width, boxes, box_colour, box_width, box_size
As in
PlotCellMap();boxesmay carry acolourcolumn.- title
Optional title centred above the map.
- title_size
Title size (points).
- style
A
ManuscriptStyle()object.
Examples
if (requireNamespace("deldir", quietly = TRUE)) {
  set.seed(2)
  d <- data.frame(x = runif(300, 0, 100), y = runif(300, 0, 100),
                  label = sample(c("t", "a"), 300, TRUE))
  tt <- TerritoryTiles(d, c(50, 50), 40, cap = 5, classes = list(tumour = "t"))
  g <- PlotTerritories(tt, colours = list(tumour = "#F4B6C2", other = "#DDDDDD"))
  grid::grid.newpage(); grid::grid.draw(g)
}