
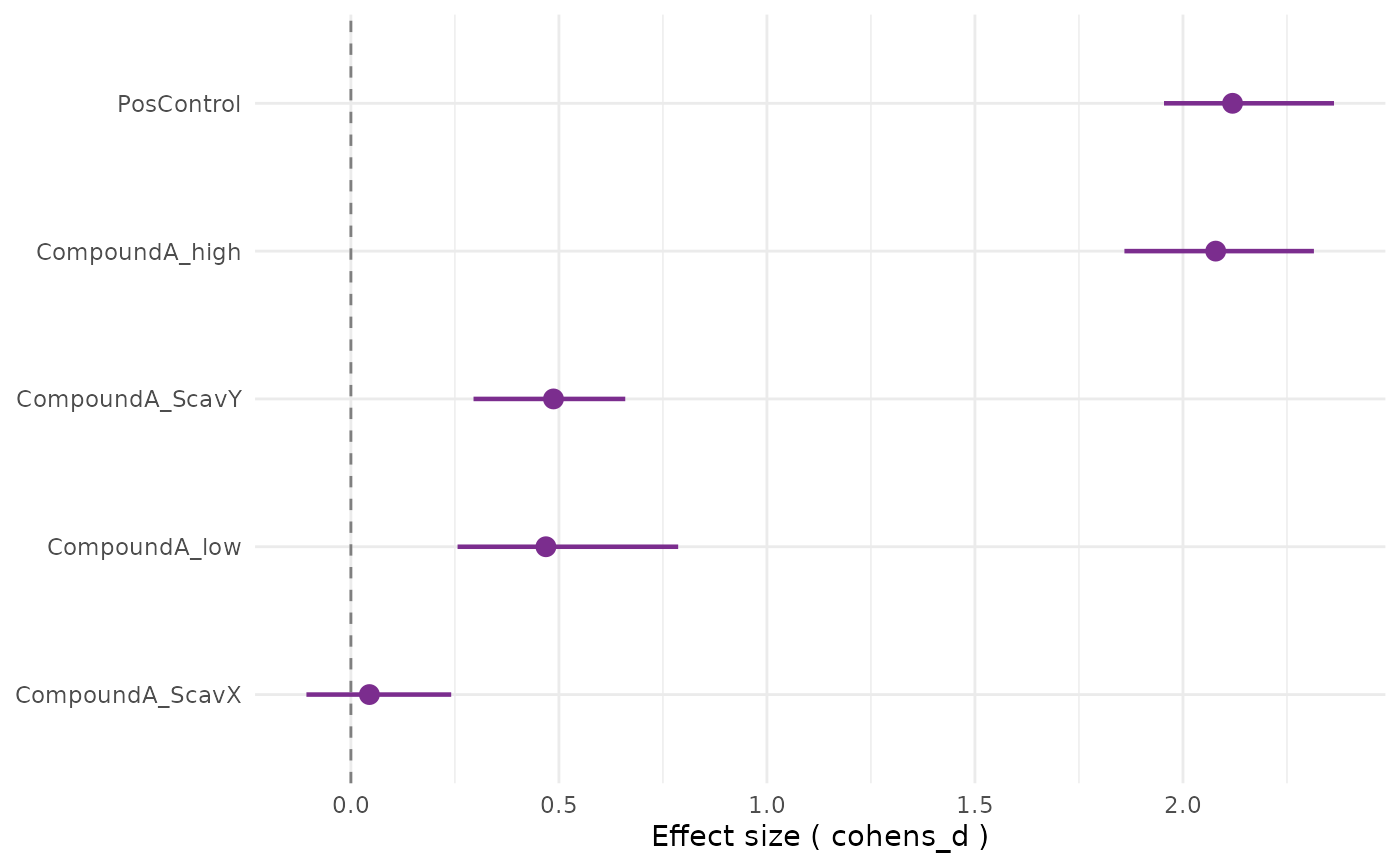
Convenience wrapper around cr_plot_forest() for the result objects
produced by cr_test() and cr_test_all(). Use cr_plot_forest()
directly for an effect-size table with its own labelling, facetting or
colouring.
Arguments
- results
A single
cr_result, a list ofcr_results (fromcr_test_all()) or a precomputed tibble with columnstreatment,method,estimate,ci_low,ci_high.- method
Effect-size method to plot (default
"cohens_d").- ...
Further arguments passed to
cr_plot_forest(), for examplefacet_by,colour_byordescending.
Examples
# \donttest{
exp <- cr_example_experiment(seed = 1, n_cells_per_well = 20)
all_res <- cr_test_all(exp, "marker_1", "Untreated", level = "replicate")
cr_plot_effect_sizes(all_res)
 # }
# }