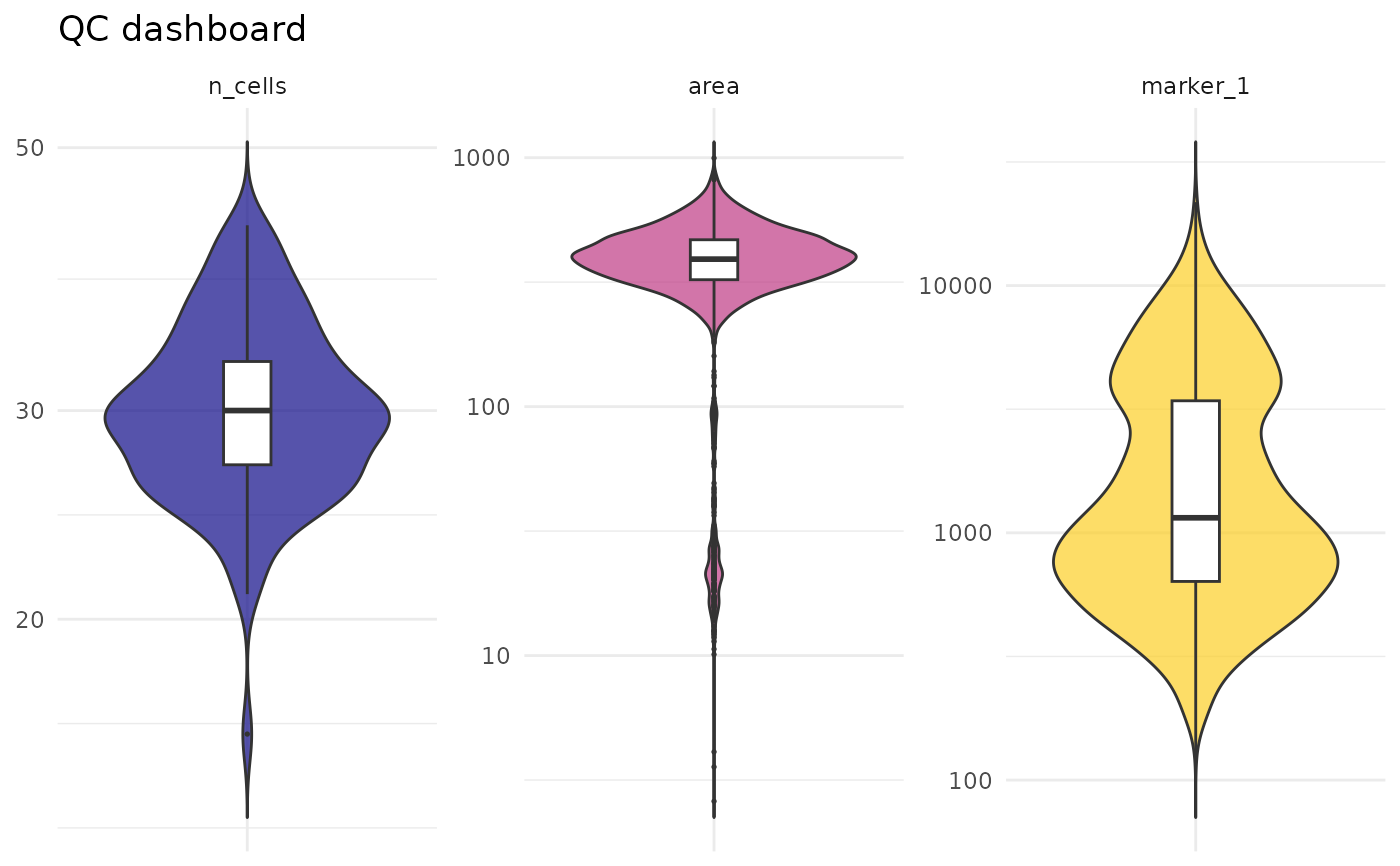
Combines cell count per well, area distributions and intensity distributions into a single multi-panel figure.
See also
cr_plot_qc_gate() for the gate against each unit's own control.
Other visualisation:
cr_plot_comparison(),
cr_plot_dose_response(),
cr_plot_effect_sizes(),
cr_plot_foldchange(),
cr_plot_heatmap(),
cr_plot_histogram(),
cr_plot_intensity(),
cr_plot_plate(),
cr_plot_roc(),
cr_plot_scatter(),
cr_plot_spatial(),
cr_plot_timeline()
Examples
exp <- cr_example_experiment(seed = 1, n_cells_per_well = 30)
cr_plot_qc(exp, channel = "marker_1")