![]()
![]()
![]()
![]()
![]()
Many simulations move entities through sequential processing stages (Stage 1 -> Stage 2 -> Stage 3 -> Stage 4). This vignette shows how to quantify throughput and identify bottlenecks.
library(dynasimR)
sim <- load_example_data()
Stage throughput
st <- stage_throughput(sim)
st
#> # A tibble: 4 × 7
#>   scenario stage      n median_time   q25   q75 completed_frac
#>   <chr>    <chr>  <int>       <dbl> <dbl> <dbl>          <dbl>
#> 1 A-S00    Stage2  4000         153    77  258              NA
#> 2 A-S01    Stage2  4000         145    74  253              NA
#> 3 A-S07    Stage2  4000         151    80  259              NA
#> 4 A-S08    Stage2  4000         151    77  259.             NA
Only Stage2 (time_to_stage2) is present in the shipped
example, but the machinery generalises to Stage1..Stage4 when the
columns exist in your simulation output.
Bottleneck detection
detect_bottlenecks(st, threshold = 0.75)
#> # A tibble: 1 × 8
#>   scenario stage      n median_time   q25   q75 completed_frac is_bottleneck
#>   <chr>    <chr>  <int>       <dbl> <dbl> <dbl>          <dbl> <lgl>
#> 1 A-S00    Stage2  4000         153    77   258             NA TRUE
Visualising first-service times
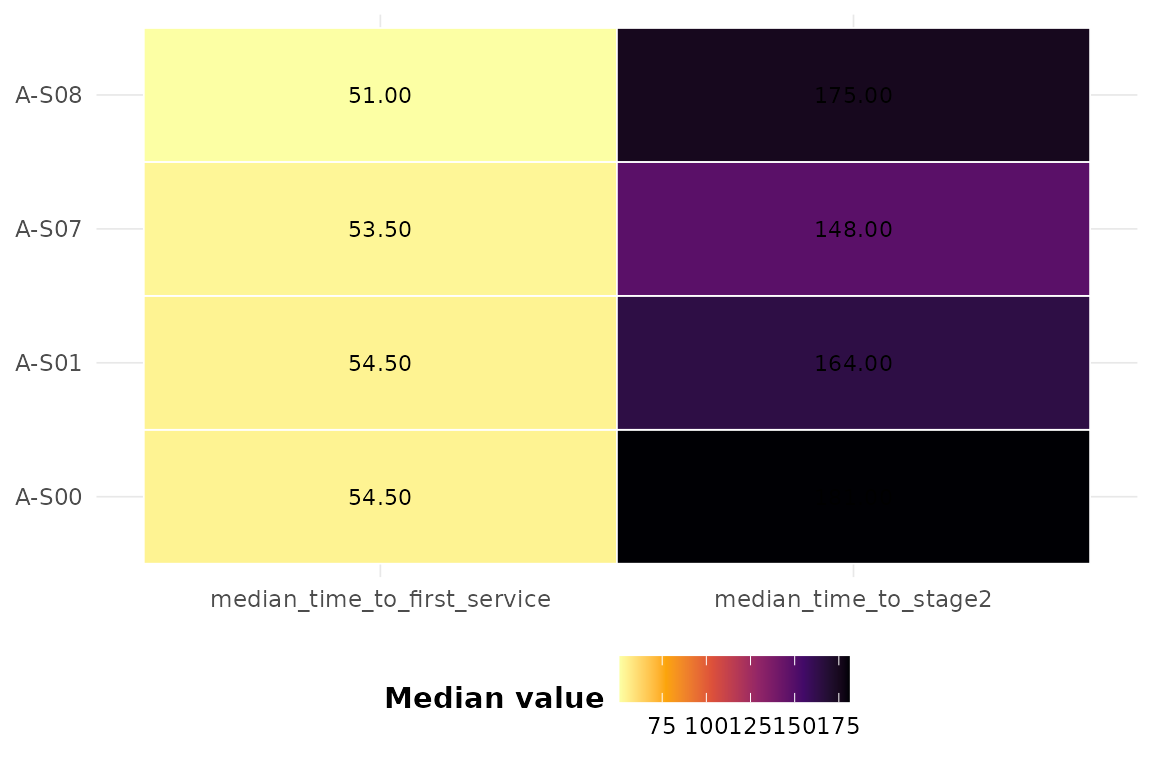
plot_scenario_heatmap(
  sim,
  metrics = c("median_time_to_first_service",
              "median_time_to_stage2")
)