![]()
![]()
![]()
![]()
![]()
library(dynasimR)
sim <- load_example_data()
The core comparison
The two Profile A scenarios A-S07 (policy B) and
A-S08 (policy A, priority by severity) differ only in the
allocation policy.
pol <- policy_effect(
  sim,
  policy_a_scenario = "A-S08",
  policy_b_scenario = "A-S07",
  n_bootstrap       = 500
)
print(pol)
#>
#> ── dynasimR_policy ─────────────────────────────────────────────────────────────
#> • Policy A: "A-S08"
#> • Policy B: "A-S07"
#> • n (reps): 50
#>
#> ── Delta event rate ──
#>
#> # A tibble: 4 × 4
#>   group median_pct_points  ci_lo ci_hi
#>   <chr>             <dbl>  <dbl> <dbl>
#> 1 all               -7.37  -9.10 -5.53
#> 2 A                -10.6  -14.4  -7.00
#> 3 B                -11.3  -14.9  -7.65
#> 4 C                 -9.39 -16.1  -4.13
#> ── Narrative ──
#> Under policy A (scenario A-S08), an event-rate reduction of 7.4 percentage points (95\%-CI: -9.1 to -5.5) was observed versus policy B (scenario A-S07) (Wilcoxon test: W = 215, p < 0.001). The Compliance Index was higher under policy A (0.919 vs. 0.658).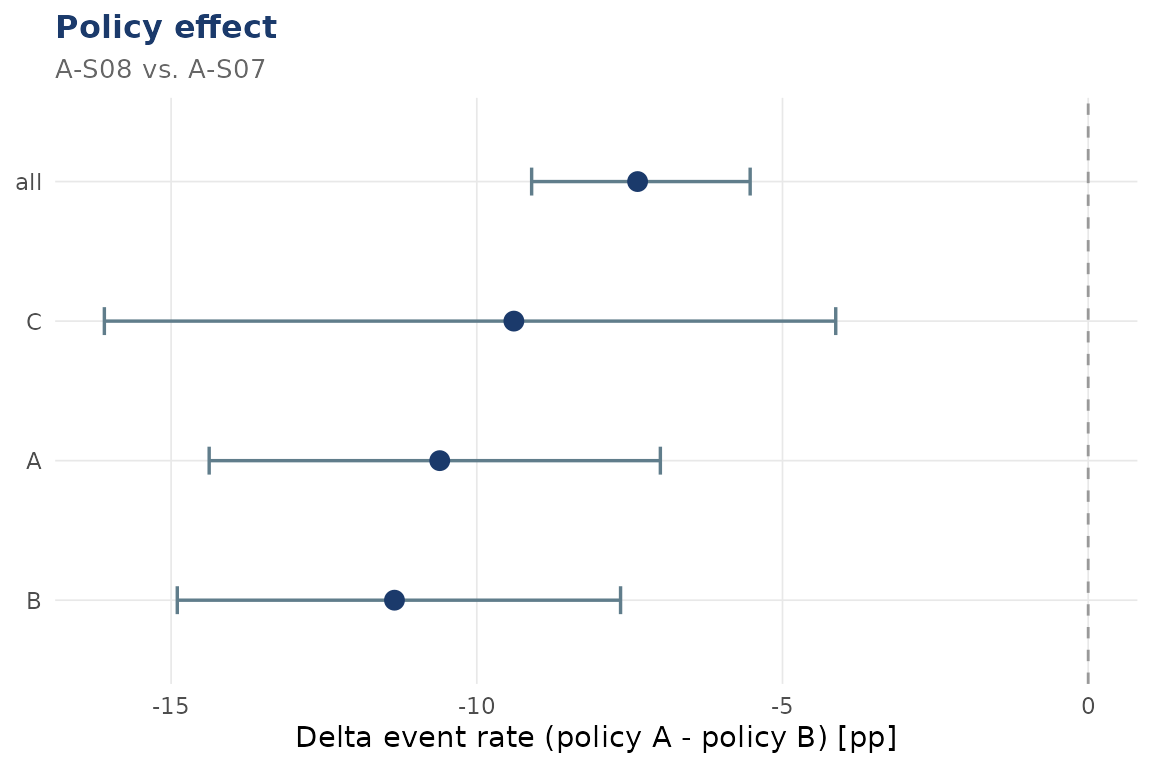
Auto-generated narrative
The narrative slot is a LaTeX-escaped string ready to
drop into a report:
cat(pol$narrative)Under policy A (scenario A-S08), an event-rate reduction of 7.4 percentage points (95%-CI: -9.1 to -5.5) was observed versus policy B (scenario A-S07) (Wilcoxon test: W = 215, p < 0.001). The Compliance Index was higher under policy A (0.919 vs. 0.658).