


library(hyperspectR)
#> hyperspectR v0.1.0 - Hyperspectral Imaging Analysis for Biomedical Applications
Hemoglobin Absorption
Tissue oxygenation assessment via HSI relies on the distinct absorption spectra of oxyhemoglobin (HbO2) and deoxyhemoglobin (Hb).
hb_data <- hs_chromophore_data(c("HbO2", "Hb"), wavelength_range = c(430, 910))
library(ggplot2)
ggplot(hb_data, aes(x = wavelength)) +
  geom_line(aes(y = HbO2, color = "HbO2"), linewidth = 0.8) +
  geom_line(aes(y = Hb, color = "Hb"), linewidth = 0.8) +
  scale_color_manual(values = c(HbO2 = "#E41A1C", Hb = "#377EB8")) +
  labs(x = "Wavelength (nm)", y = "Extinction Coefficient",
       title = "Hemoglobin Absorption Spectra", color = "") +
  theme_hsi()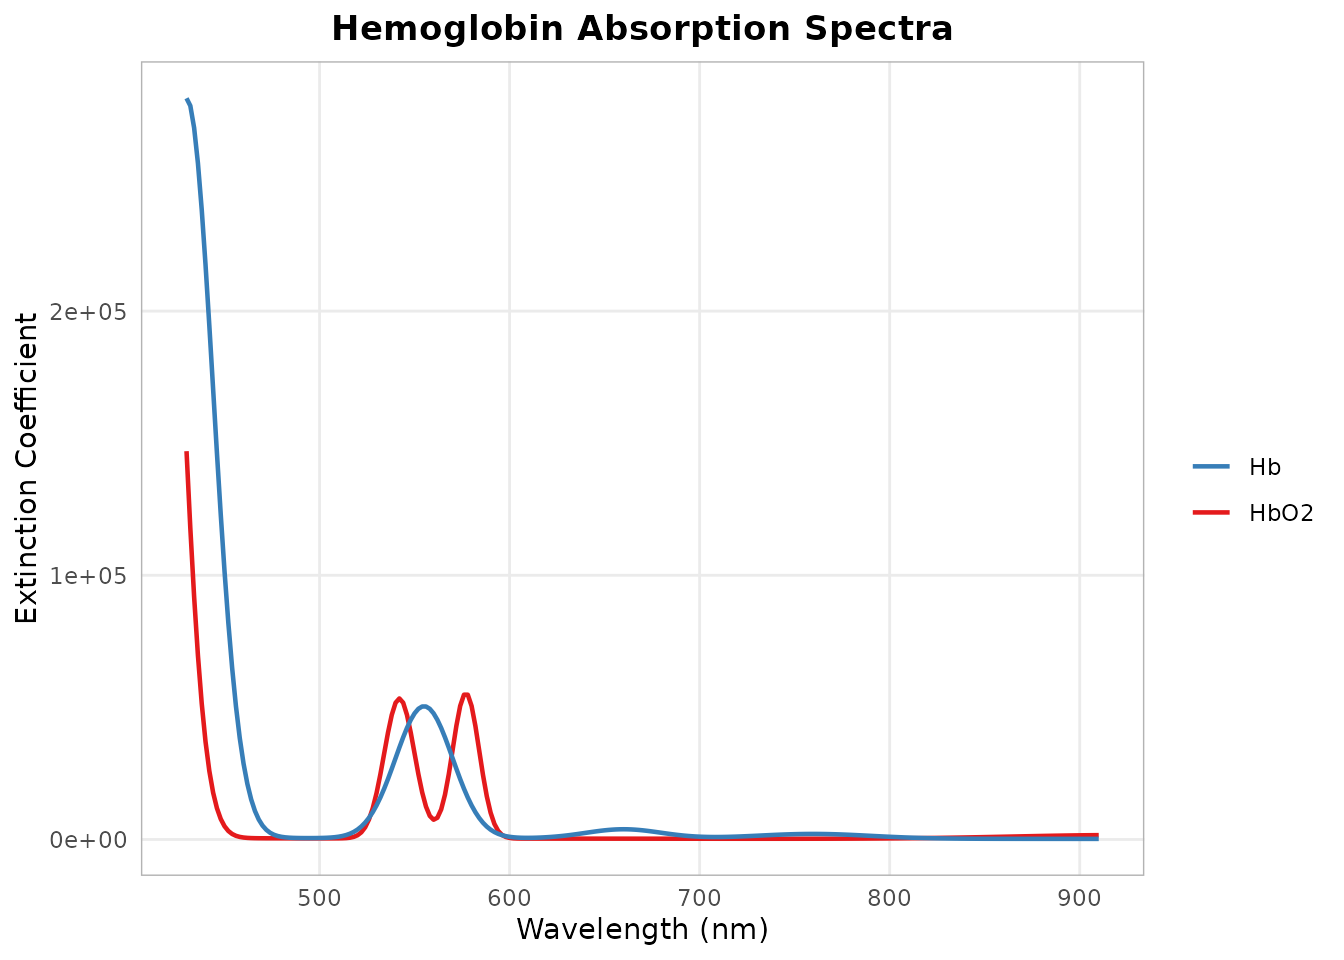
Tissue Oxygen Saturation (StO2)
StO2 estimates superficial tissue oxygenation (~1 mm depth) by comparing reflectance in the visible Hb absorption region (500-650 nm) to the NIR region (700-815 nm).
cube <- hs_example_cube()
sto2 <- hs_sto2(cube)
hs_plot_index(sto2, title = "StO2 (%)", palette = "sto2")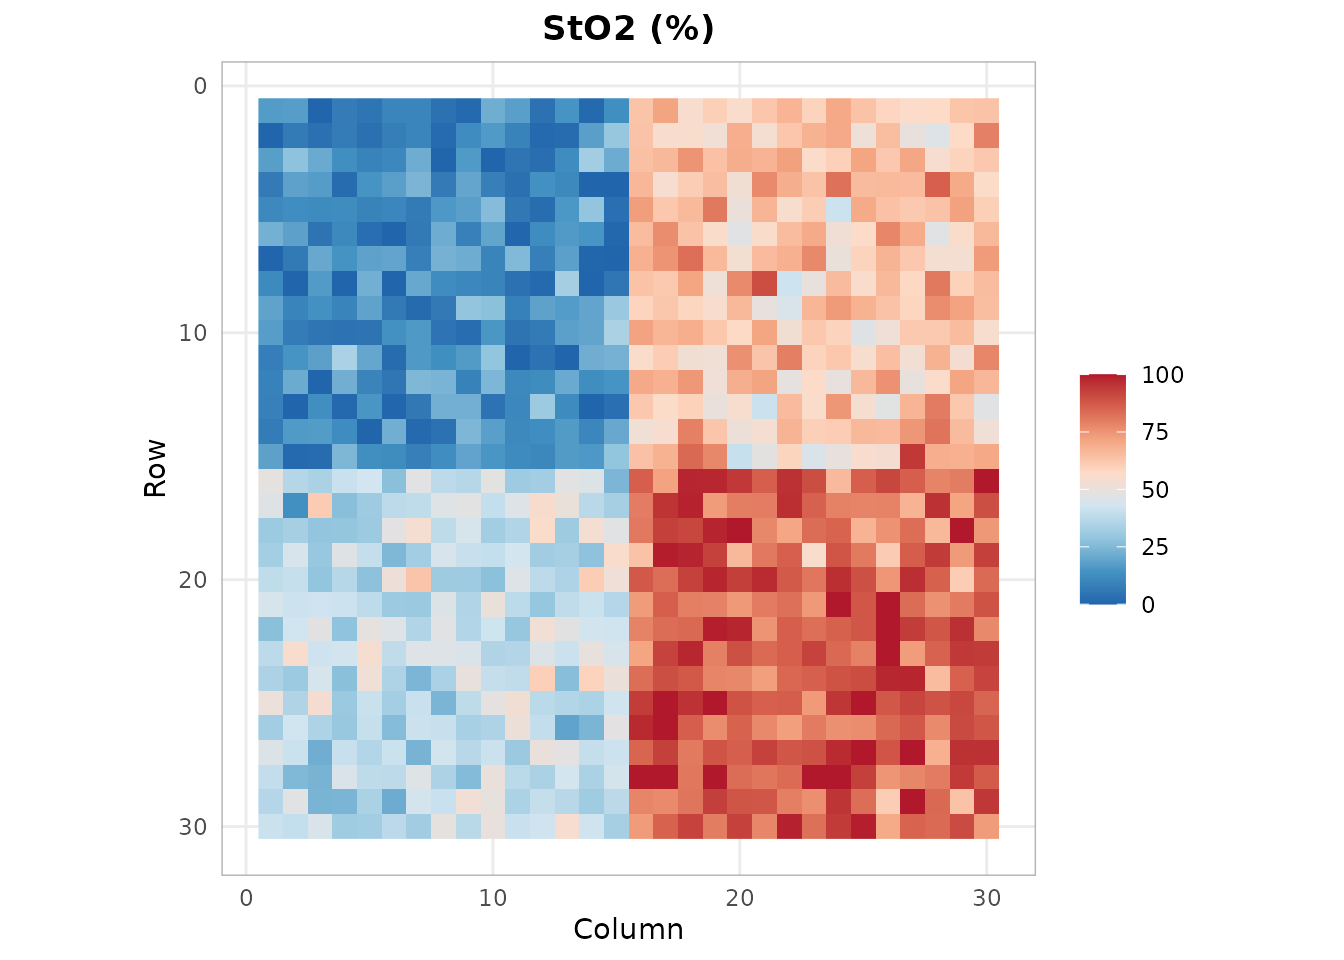
Near-Infrared Perfusion Index (NPI)
NPI probes deeper tissue layers (4-6 mm) using NIR wavelengths (655-910 nm).
npi <- hs_npi(cube)
hs_plot_index(npi, title = "NPI (%)", palette = "perfusion")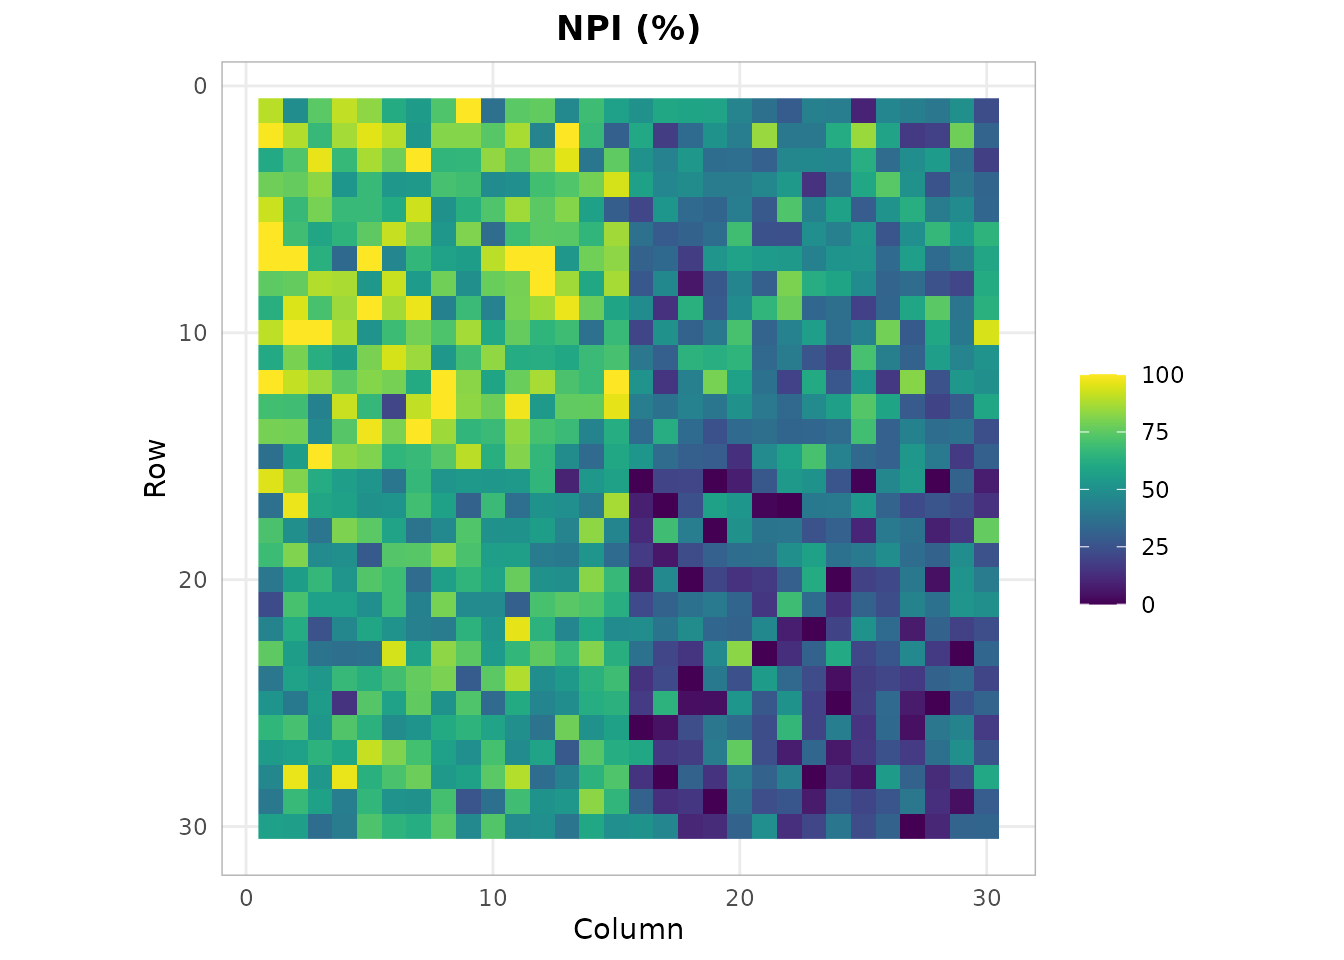
Tissue Hemoglobin Index (THI)
THI estimates relative hemoglobin concentration from the Q-band absorption depth (530-590 nm) relative to a reference region (785-825 nm).
thi <- hs_thi(cube)
hs_plot_index(thi, title = "THI (%)", palette = "hemoglobin")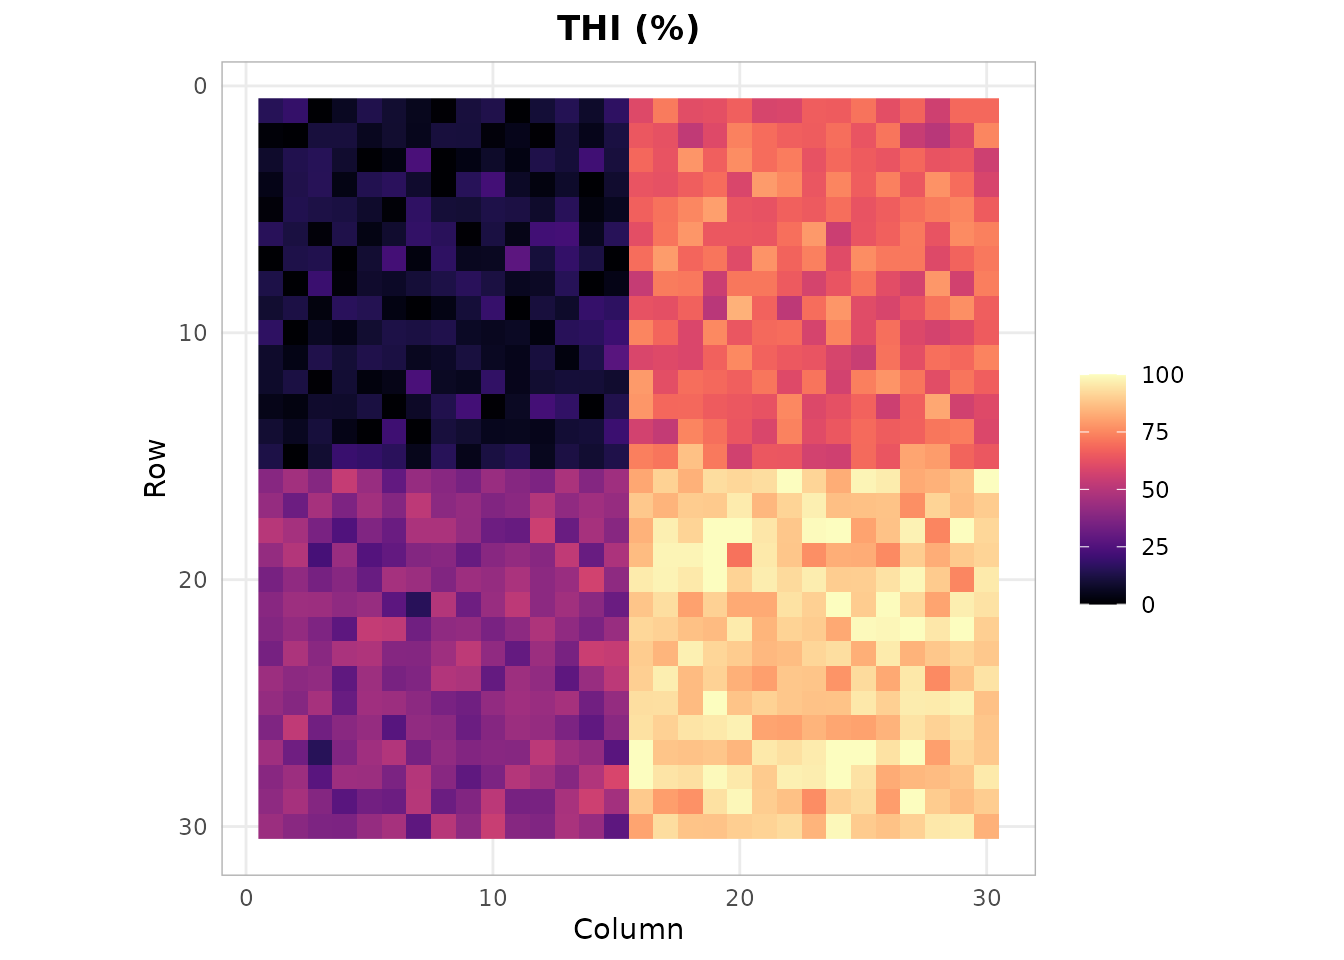
Custom Normalized Difference Index
Create any two-band ratio index:
ndi <- hs_ndi(cube, band1 = 540, band2 = 660)
hs_plot_index(ndi, title = "NDI (540/660)", range = c(-1, 1))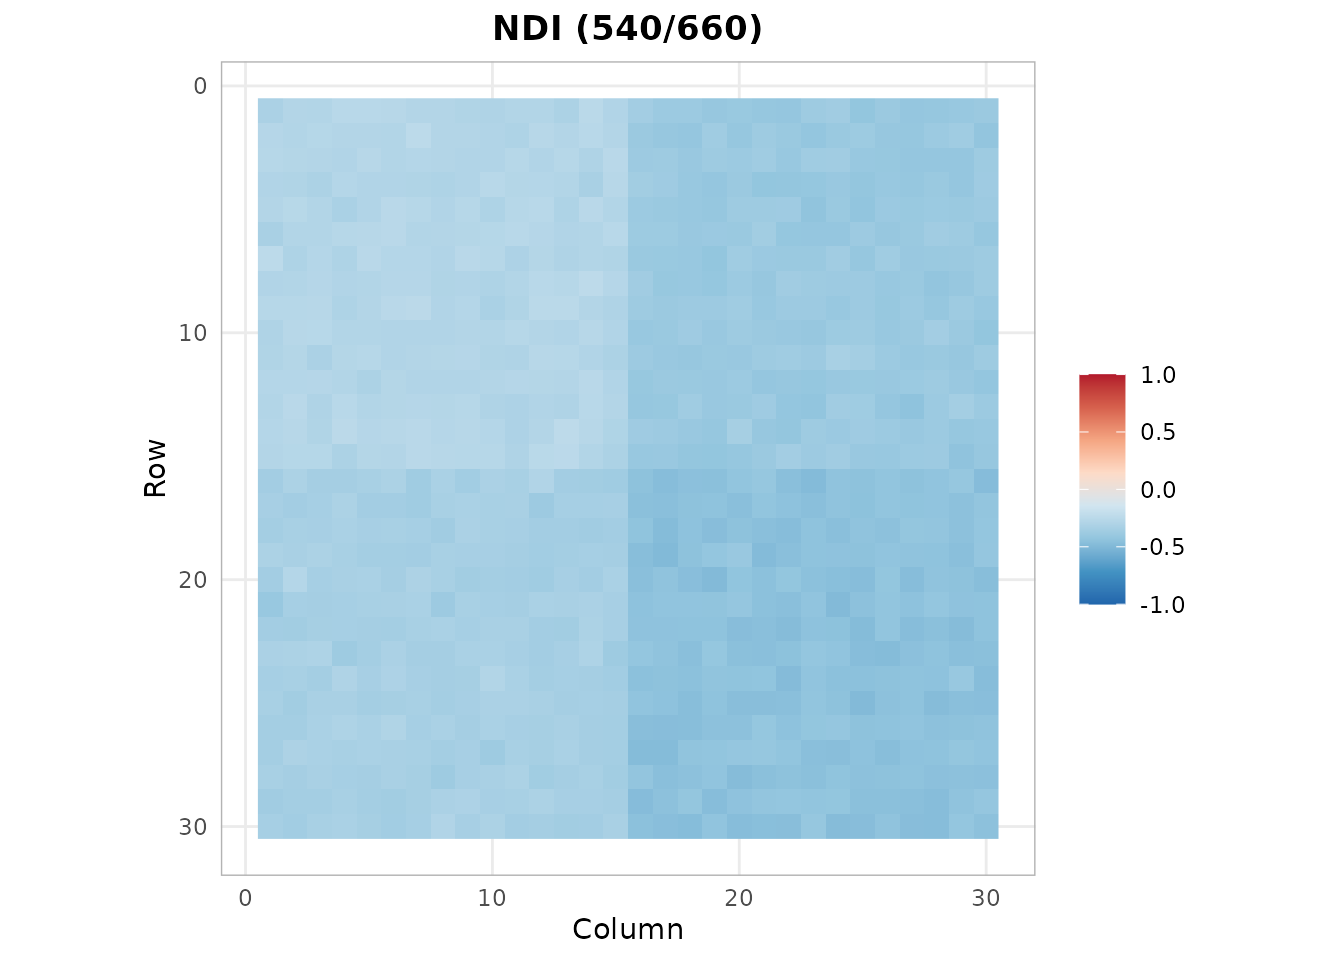
Clinical Panel
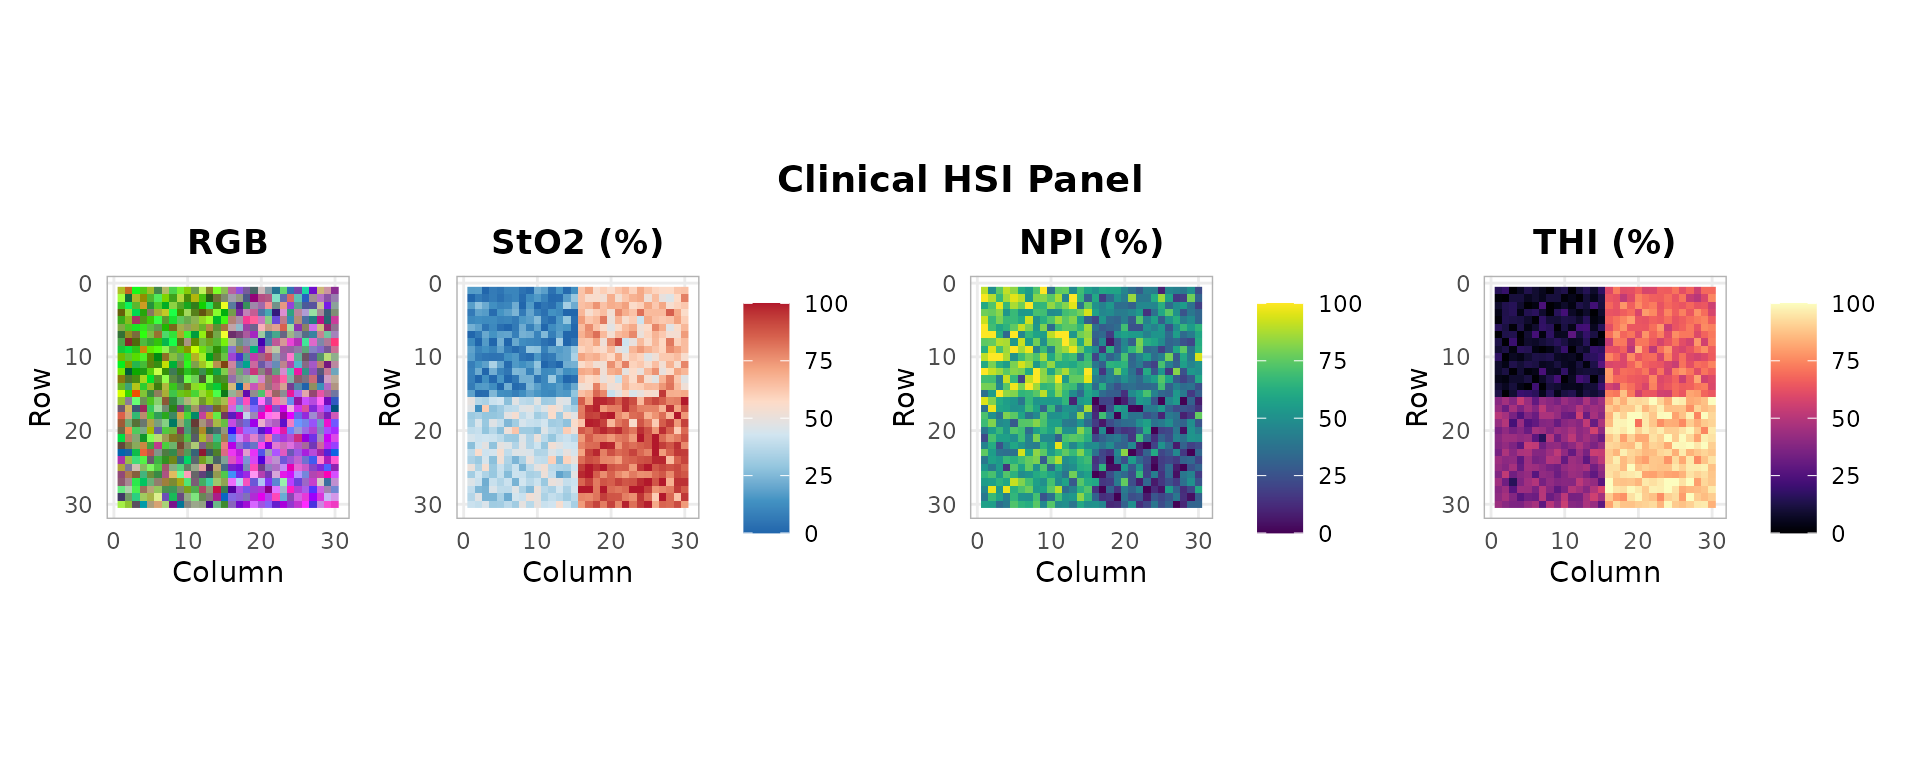
The TIVITA-style 5-panel display combines RGB with all indices:
hs_plot_clinical(cube)