38 Case Study 1: CRISPR Field Review (2010–2024)
R. Heller · Date: 2026-05-09 · Last changed: 2026-10-30
38.1 Objective
Map the structure, growth, and evolution of CRISPR gene editing research from its emergence to its current state using open bibliometric data.
38.3 Data acquisition
works <- fetch_openalex(
  entity = "works",
  search = "CRISPR",
  from_publication_date = "2010-01-01",
  to_publication_date = "2024-06-30",
  type = "article",
  options = list(sample = 500, seed = 42)
)

works <- works |>
  mutate(year = year(publication_date))

cat(glue("CRISPR articles retrieved: {nrow(works)}\n"))
#> CRISPR articles retrieved: 500#> Year range: 2010--202438.4 Publication growth
works |>
  count(year) |>
  ggplot(aes(x = year, y = n)) +
  geom_col(fill = palette_sci(1)) +
  labs(x = "Year", y = "Publications") +
  theme_sci()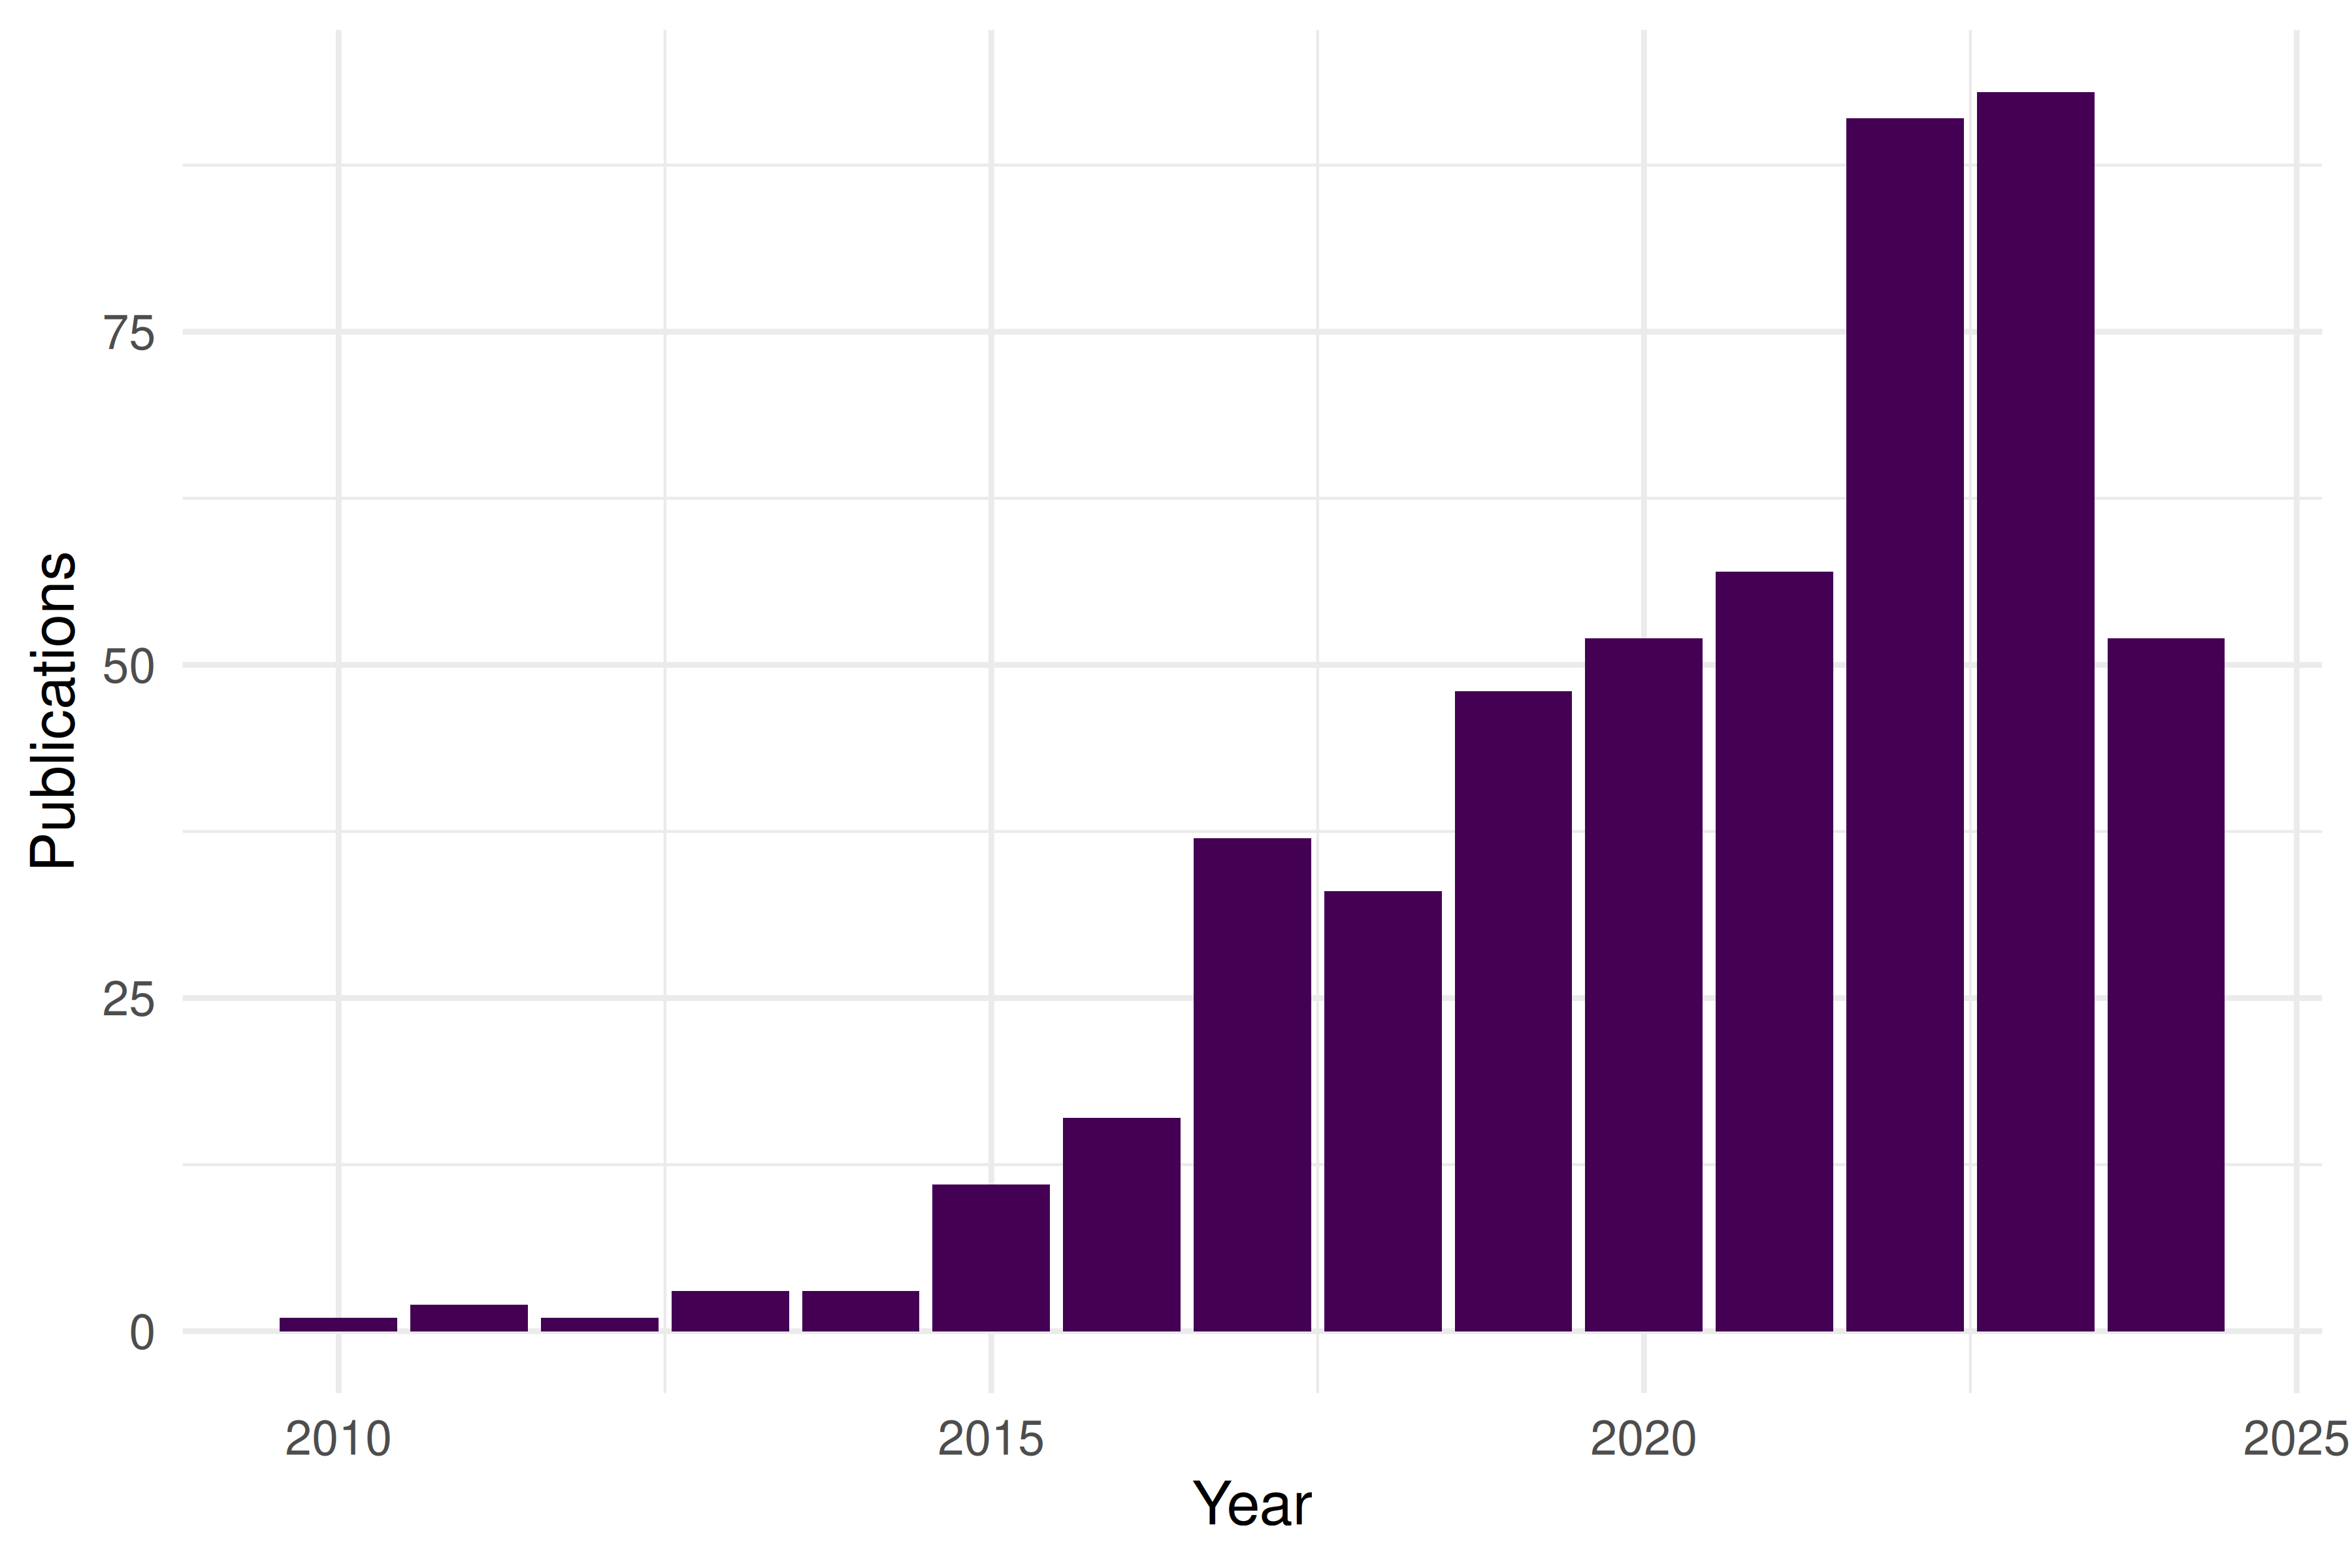
Figure 38.1: Annual publication output in the CRISPR field.
38.5 Citation landscape
ggplot(works, aes(x = cited_by_count)) +
  geom_histogram(binwidth = 10, fill = palette_sci(1), colour = "white") +
  labs(x = "Citations", y = "Papers") +
  theme_sci()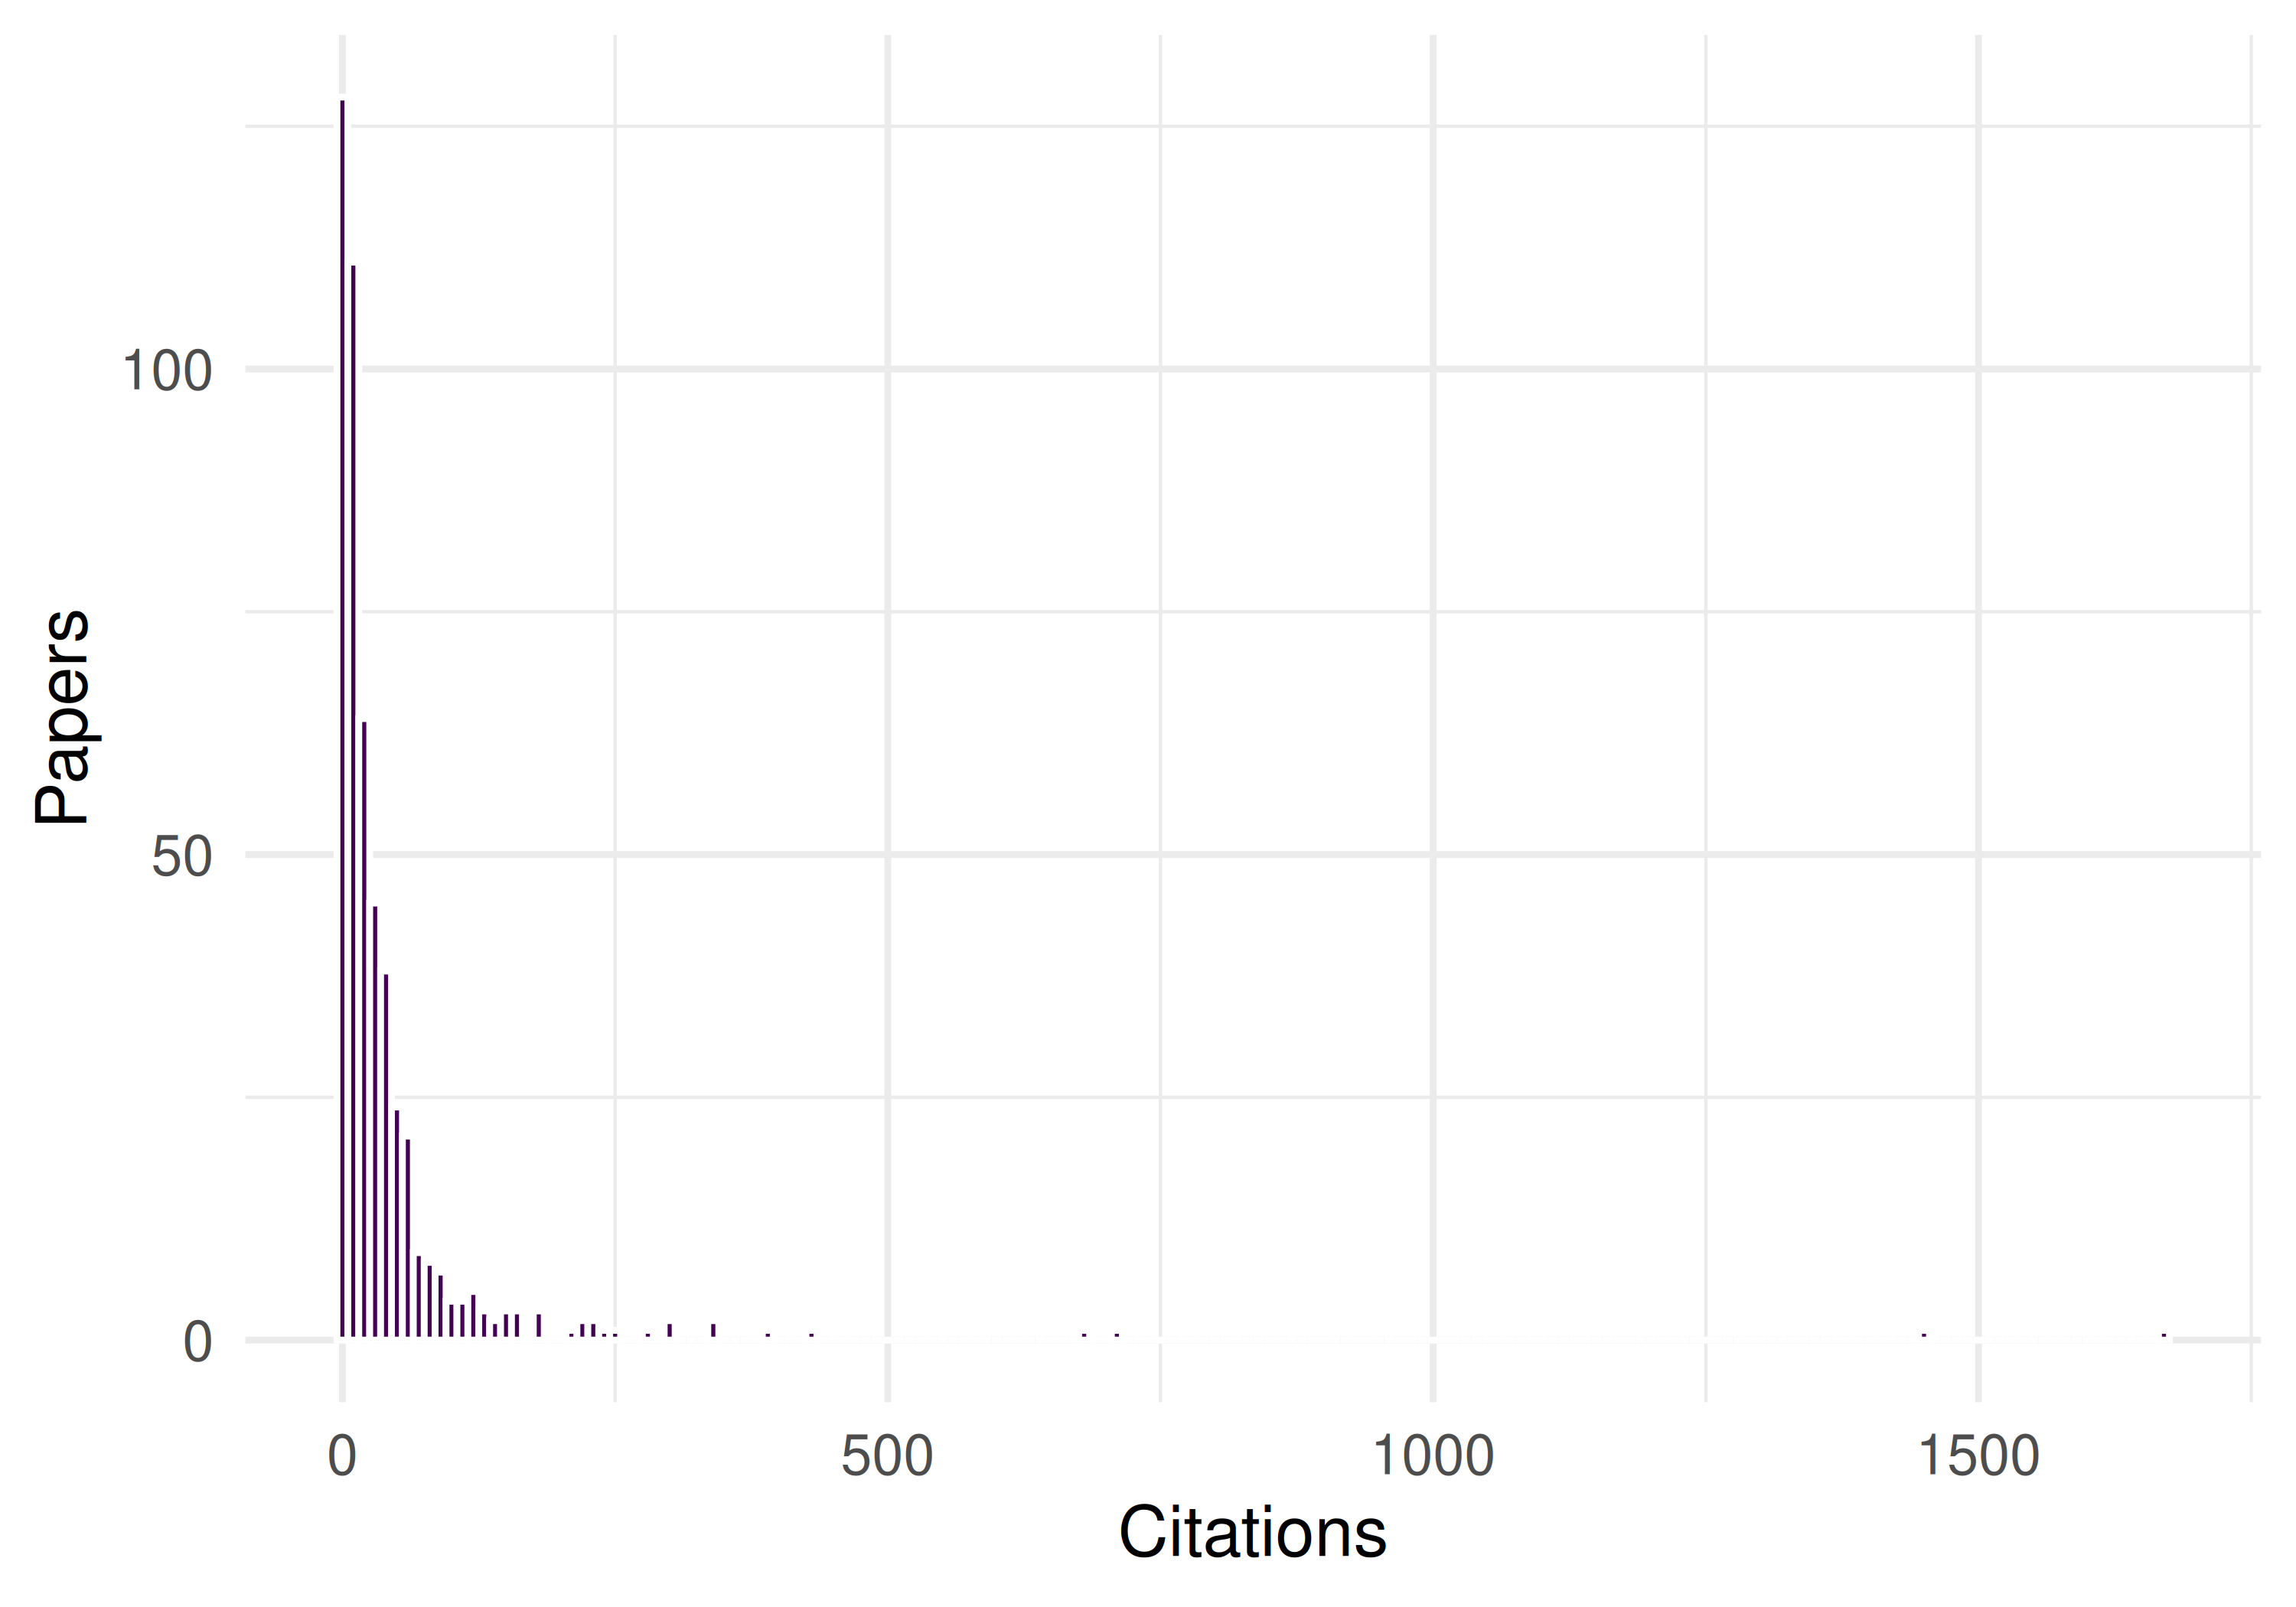
Figure 38.2: Citation distribution of CRISPR articles.
works |>
  arrange(desc(cited_by_count)) |>
  head(10) |>
  select(display_name, year, cited_by_count, source_display_name) |>
gt()| display_name | year | cited_by_count | source_display_name |
|---|---|---|---|
| CRISPR-Cas12a-assisted nucleic acid detection | 2018 | 1670 | Cell Discovery |
| Prioritization of cancer therapeutic targets using CRISPR–Cas9 screens | 2019 | 1452 | Nature |
| Self versus non-self discrimination during CRISPR RNA-directed immunity | 2010 | 715 | Nature |
| CRISPR/Cas9 systems targeting β-globin and CCR5 genes have substantial off-target activity | 2013 | 682 | Nucleic Acids Research |
| Optimized gene editing technology for Drosophila melanogaster using germ line-specific Cas9 | 2013 | 427 | Proceedings of the National Academy of Sciences |
| Combinatorial CRISPR–Cas9 screens for de novo mapping of genetic interactions | 2017 | 392 | Nature Methods |
| Small extracellular vesicles containing arginase-1 suppress T-cell responses and promote tumor growth in ovarian carcinoma | 2019 | 337 | Nature Communications |
| Two Distant Catalytic Sites Are Responsible for C2c2 RNase Activities | 2017 | 336 | Cell |
| Aneuploidy renders cancer cells vulnerable to mitotic checkpoint inhibition | 2021 | 303 | Nature |
| Coronavirus endoribonuclease targets viral polyuridine sequences to evade activating host sensors | 2020 | 301 | Proceedings of the National Academy of Sciences |
38.6 Co-authorship network
author_data <- works |>
  select(id, authorships) |>
  unnest(authorships, names_sep = "_") |>
  select(work_id = id, author_id = authorships_id,
         author_name = authorships_display_name) |>
  filter(!is.na(author_id))

edges <- author_data |>
  inner_join(author_data, by = "work_id", suffix = c("_1", "_2"),
             relationship = "many-to-many") |>
  filter(author_id_1 < author_id_2) |>
  count(author_id_1, author_id_2, name = "weight")

g <- graph_from_data_frame(
  edges |> select(author_id_1, author_id_2, weight),
  directed = FALSE
) |> simplify(edge.attr.comb = list(weight = "sum"))

comp <- components(g)
giant <- induced_subgraph(g, which(comp$membership == which.max(comp$csize)))
V(giant)$community <- as.factor(membership(
  cluster_leiden(giant, resolution_parameter = 1.0,
                 objective_function = "modularity")
))
V(giant)$degree <- degree(giant)

cat(glue("Network: {vcount(giant)} nodes, {ecount(giant)} edges\n"))
#> Network: 46 nodes, 1035 edges
set.seed(42)
ggraph(as_tbl_graph(giant), layout = "fr") +
  geom_edge_link(alpha = 0.1, colour = "grey60") +
  geom_node_point(aes(size = degree, colour = community), alpha = 0.7) +
  scale_size_continuous(range = c(0.5, 5), guide = "none") +
  scale_colour_manual(values = palette_sci(n_distinct(V(giant)$community))) +
  labs(colour = "Community") +
  theme_void(base_family = "sans", base_size = 11) + theme(legend.position = "bottom")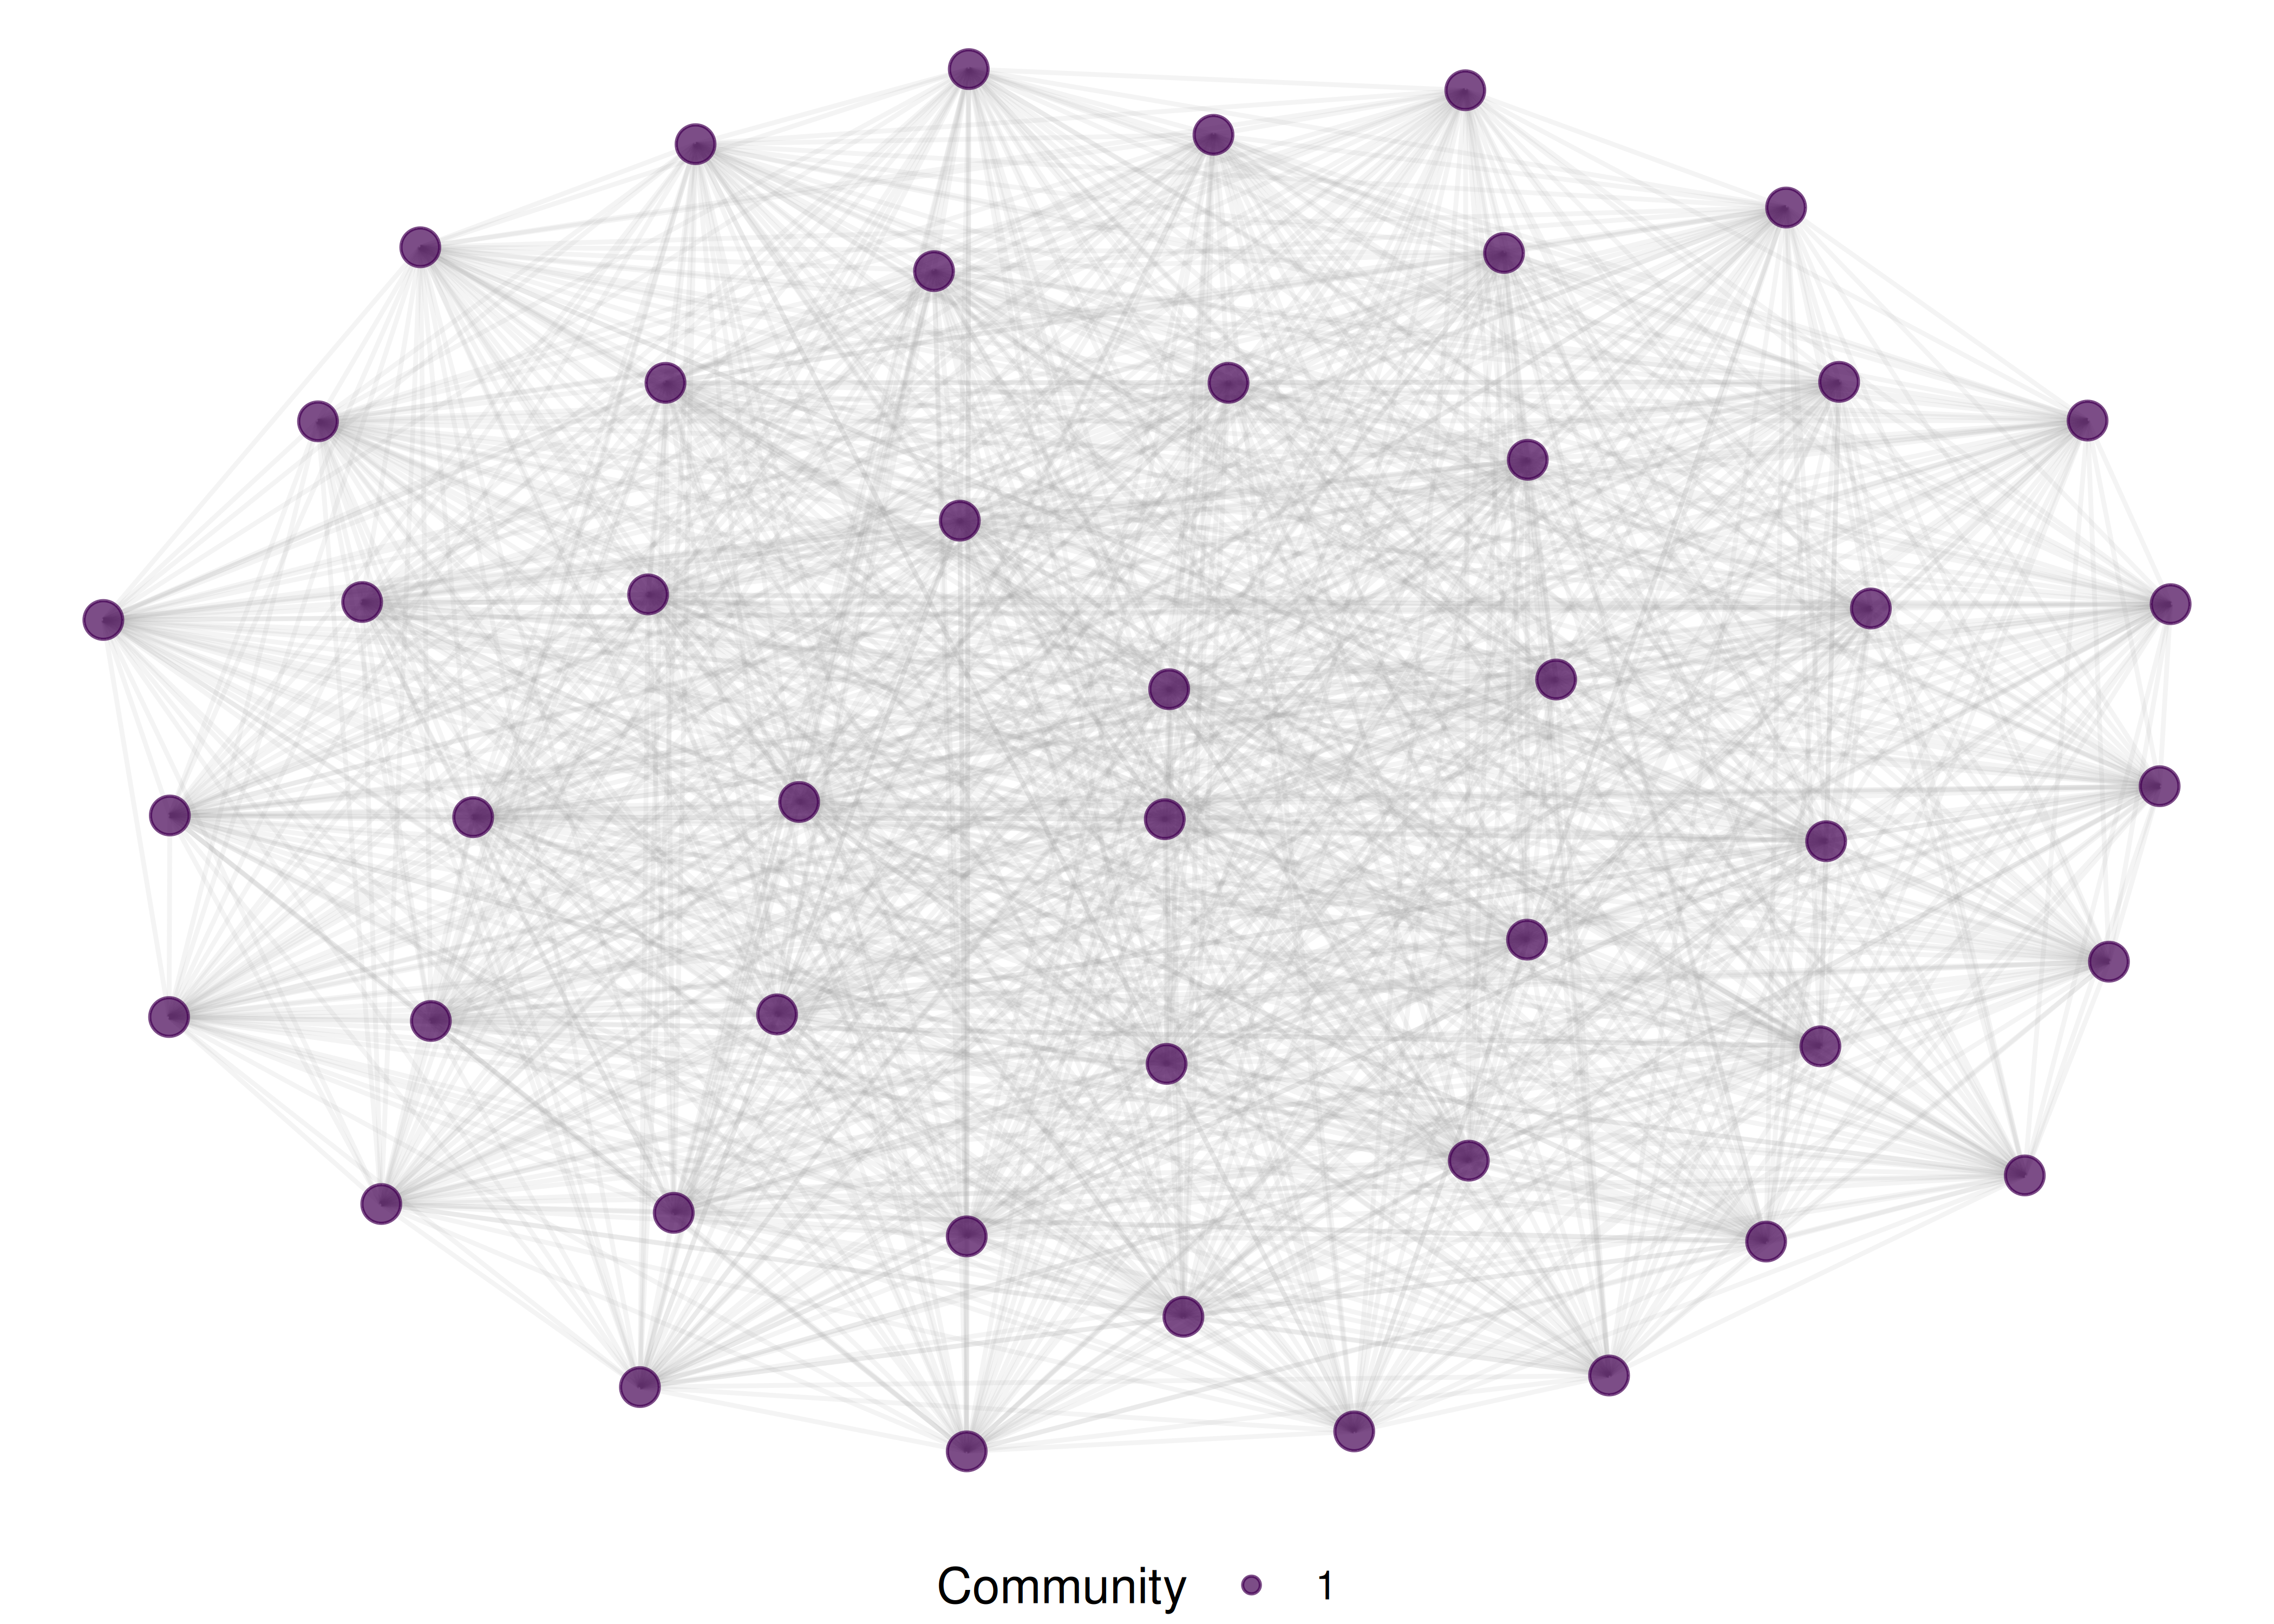
Figure 38.3: Co-authorship network of CRISPR researchers.
38.7 Topic evolution
text_df <- works |>
  filter(!is.na(abstract), nchar(abstract) > 50) |>
  transmute(doc_id = id, text = paste(display_name, abstract, sep = ". "), year)

corp <- corpus(text_df, docid_field = "doc_id", text_field = "text")
toks <- tokens(corp, remove_punct = TRUE, remove_numbers = TRUE) |>
  tokens_tolower() |>
  tokens_remove(stopwords("en")) |>
  tokens_remove(c("study", "paper", "results", "using", "based"))

dfmat <- dfm(toks) |> dfm_trim(min_termfreq = 5, min_docfreq = 3)

top_by_year <- map_dfr(unique(text_df$year), function(yr) {
  docs <- docvars(dfmat, "year") == yr
  if (sum(docs) < 5) return(tibble())
  top <- topfeatures(dfmat[docs, ], 5)
  tibble(year = yr, term = names(top), freq = unname(top))
})
top_by_year |>
  group_by(year) |>
  mutate(term = reorder_within(term, freq, year)) |>
  ggplot(aes(x = freq, y = term)) +
  geom_col(fill = palette_sci(1)) +
  facet_wrap(~ year, scales = "free_y", ncol = 4) +
  scale_y_reordered() +
  labs(x = "Frequency", y = NULL) +
  theme_sci(base_size = 8)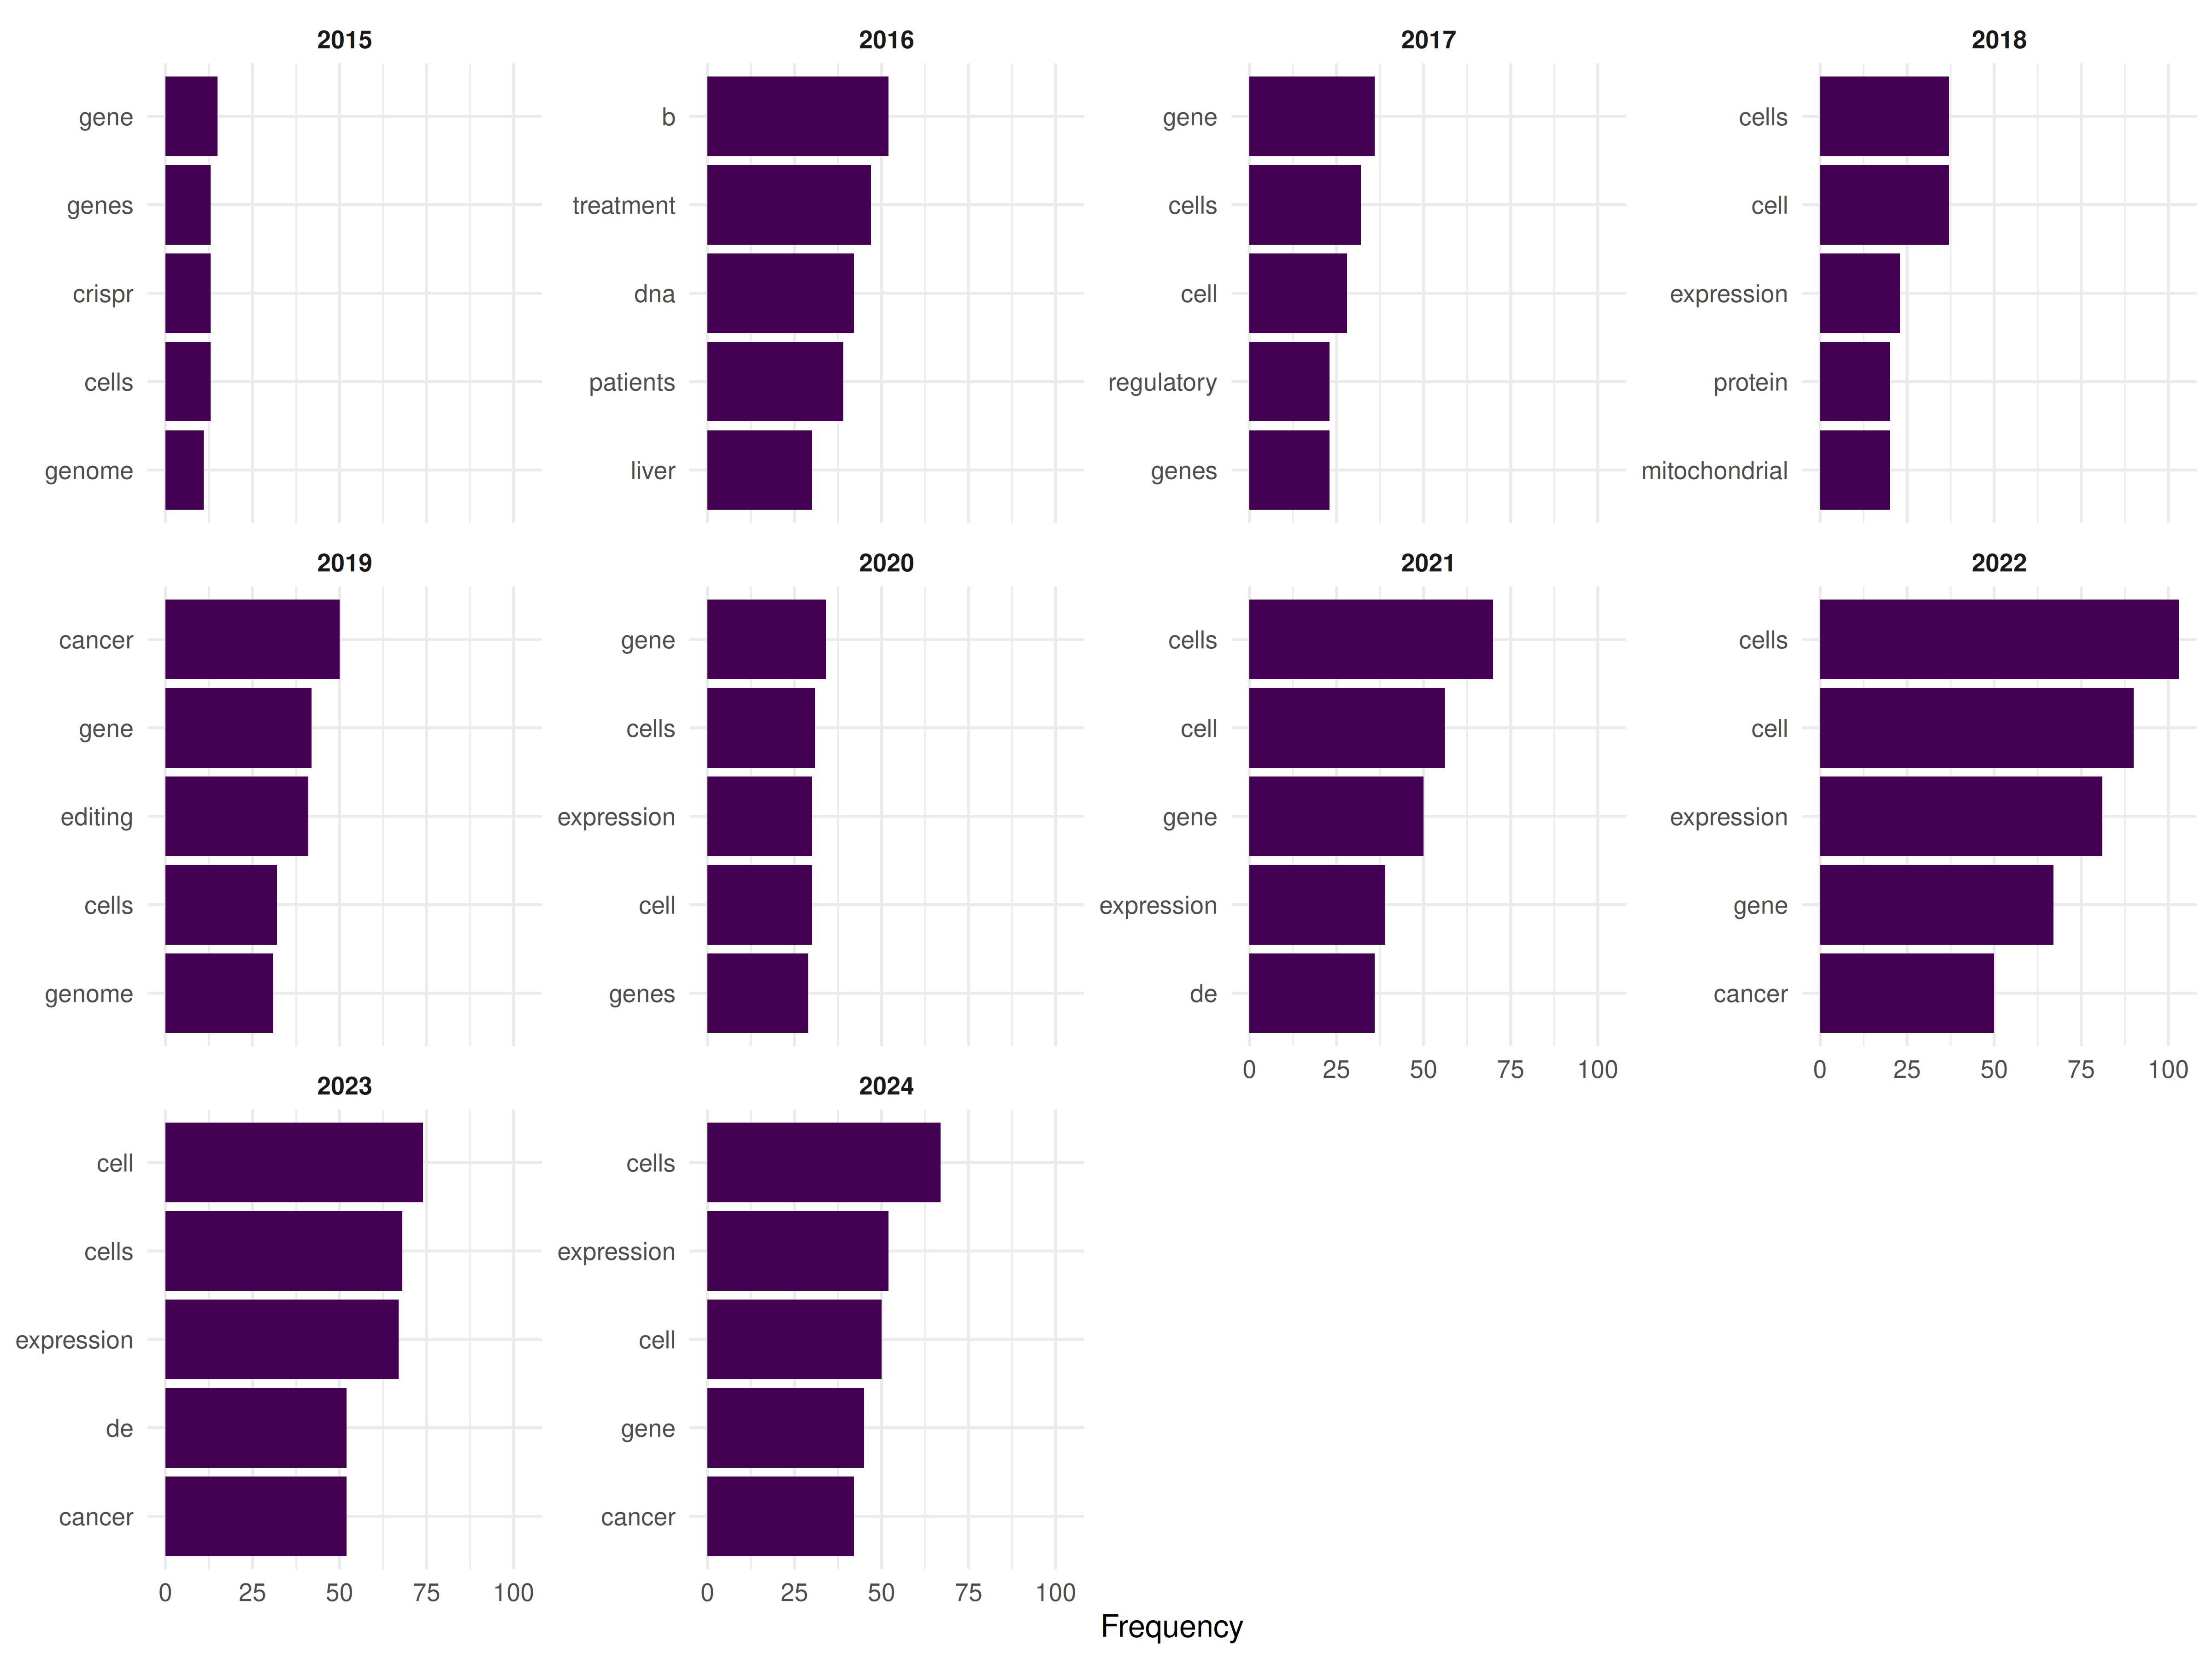
Figure 38.4: Top terms by year showing topical evolution.
38.8 Key findings
- Explosive growth: CRISPR publications grew exponentially from 2012, reflecting the rapid adoption of Cas9-based editing.
- Citation concentration: A small number of foundational papers dominate the citation landscape.
- Collaborative structure: The co-authorship network shows distinct communities, likely corresponding to different application domains (therapeutics, agriculture, basic biology).
- Topic evolution: Early terms focus on methodology; later years shift toward applications and clinical translation.
38.9 Lessons learned
- OpenAlex sampling provides a representative snapshot but may miss some highly specialised or non-English publications.
- The citation distribution is extreme: median citations are far below the mean, making median-based statistics essential.
- Co-authorship networks in fast-growing fields are fragmented; many research groups work independently.
This book was built by the bookdown R package.