10 Productivity and Impact Indicators
R. Heller · Date: 2026-05-09 · Last changed: 2026-10-31
10.1 Learning objectives
After completing this chapter, you will be able to:
- Compute sample h- and g-indices and distinguish a corpus publication span from an author career
- Explain the difference between size-dependent and size-independent indicators
- Explain the external reference sets needed for MNCS and PP(top 10%), and diagnose misleading within-sample normalization
- Articulate the limitations of each indicator and the risks of misuse, citing the Leiden Manifesto
10.3 Conceptual background
Quantitative indicators are central to research evaluation — and among the most contested tools in science policy. The h-index, proposed by Hirsch (2005), counts the number h of an author’s papers that have each received at least h citations. Its simplicity made it wildly popular, but also obscures important nuances: it conflates productivity with impact, is insensitive to highly cited papers, and can only increase over a career (Waltman 2016).
The g-index (Egghe 2006) addresses the insensitivity to top-cited papers by requiring that the top g papers have together received at least g² citations. The m-quotient divides the h-index by career length, offering a rough age correction.
These are all raw indicators. Citation distributions differ across fields, so comparisons require a justified reference and field normalization. The Mean Normalized Citation Score (MNCS) divides each paper’s citations by the world average for its field and publication year (Waltman et al. 2011). The PP(top 10%) — the proportion of an entity’s papers in the top 10% most cited in their field — is a percentile-based indicator recommended by the Leiden Ranking.
The Leiden Manifesto (Hicks et al. 2015) and the San Francisco Declaration on Research Assessment (American Society for Cell Biology 2012) both caution against mechanical use of any single indicator. Indicators should support, not replace, qualitative judgement.
10.4 Worked example
10.4.1 Acquiring sample data
We fetch a sample of works and their citation counts from OpenAlex.
works <- fetch_openalex(
  entity = "works",
  primary_location.source.id = "S148561398",
  from_publication_date = "2018-01-01",
  to_publication_date = "2023-12-31",
  options = list(sample = 500, seed = 42)
)

works_slim <- works |>
  select(id, display_name, publication_date, cited_by_count, doi) |>
  mutate(year = year(publication_date))

summary(works_slim$cited_by_count)
#> Min. 1st Qu. Median Mean 3rd Qu. Max.
#> 0.0 8.0 17.5 34.2 36.2 1658.010.4.2 Computing the h-index
#> h-index for this corpus: 62The sample h-index means that at least 62 sampled papers each have at least 62 citations. It is not an author career h-index.
10.4.3 Computing the g-index
compute_g_index <- function(citations) {
  sorted <- sort(citations, decreasing = TRUE)
  cumsum_cites <- cumsum(sorted)
  g_candidates <- which(cumsum_cites >= seq_along(sorted)^2)
  if (length(g_candidates) == 0) return(0L)
  as.integer(max(g_candidates))
}

g <- compute_g_index(works_slim$cited_by_count)
cat(glue("g-index for this corpus: {g}\n"))
#> g-index for this corpus: 10510.4.4 Publication span is not career length
A proper m-quotient needs an identified author and a justified career-start date. This corpus contains many authors, so its publication span cannot supply that denominator. The following h/span ratio is only a descriptive calculation.
career_years <- as.numeric(
  difftime(max(works_slim$publication_date),
           min(works_slim$publication_date),
           units = "days")
) / 365.25

h_per_span <- if (is.finite(career_years) && career_years > 0) h / career_years else NA_real_
cat(glue("Sample h/publication-span ratio: {round(h_per_span, 3)} (span {round(career_years, 1)} years)\n"))
#> Sample h/publication-span ratio: 10.407 (span 6 years)10.4.5 A normalization diagnostic: using the sample as its own reference
MNCS requires a justified field/year reference with compatible document types and citation windows. The live corpus here supplies no such reference. To show why that matters, compute a mean within each sample year and divide the same records by it. Every usable year must average to 1 by construction. These are observed sample means, not simulated field means or world averages.
sample_means_by_year <- works_slim |>
  group_by(year) |>
  summarise(sample_mean = mean(cited_by_count, na.rm = TRUE), .groups = "drop")

works_normalized <- works_slim |>
  left_join(sample_means_by_year, by = "year") |>
  mutate(ncs = field_normalize(cited_by_count, sample_mean))

sample_ratio <- mean(works_normalized$ncs, na.rm = TRUE)
cat(glue("Mean within-sample/year ratio: {round(sample_ratio, 3)}\n"))
#> Mean within-sample/year ratio: 1A value of 1 here is an arithmetic identity, not evidence of world-average impact. Zero-mean years have undefined ratios and are excluded. An actual MNCS interpretation requires an independently justified field/year reference (Waltman et al. 2011).
10.4.6 Within-sample upper-percentile membership
works_with_pct <- works_normalized |>
  group_by(year) |>
  mutate(
    pct_rank = percent_rank(cited_by_count),
    is_top10 = pct_rank >= 0.90
  ) |>
  ungroup()

pp_top10 <- mean(works_with_pct$is_top10, na.rm = TRUE)
cat(glue("Share at or above the sample/year 90th percentile rank: {scales::percent(pp_top10, accuracy = 0.1)}\n"))
#> Share at or above the sample/year 90th percentile rank: 10.8%The ranks use only sampled works in each year. Ties and small groups can make the selected share differ from 10%; a singleton has no percentile rank. This is not field-normalized PP(top 10%). Report the ranking and tie rule explicitly.
10.4.7 Visualization
works_slim |>
  ggplot(aes(x = cited_by_count)) +
  geom_histogram(binwidth = 5, fill = palette_sci(1), color = "white") +
  geom_vline(xintercept = h, linetype = "dashed", color = "red", linewidth = 0.8) +
  annotate("text", x = h + 5, y = Inf, label = glue("h = {h}"),
           vjust = 2, hjust = 0, color = "red", size = 4) +
  labs(x = "Citation count", y = "Number of works") +
  theme_sci()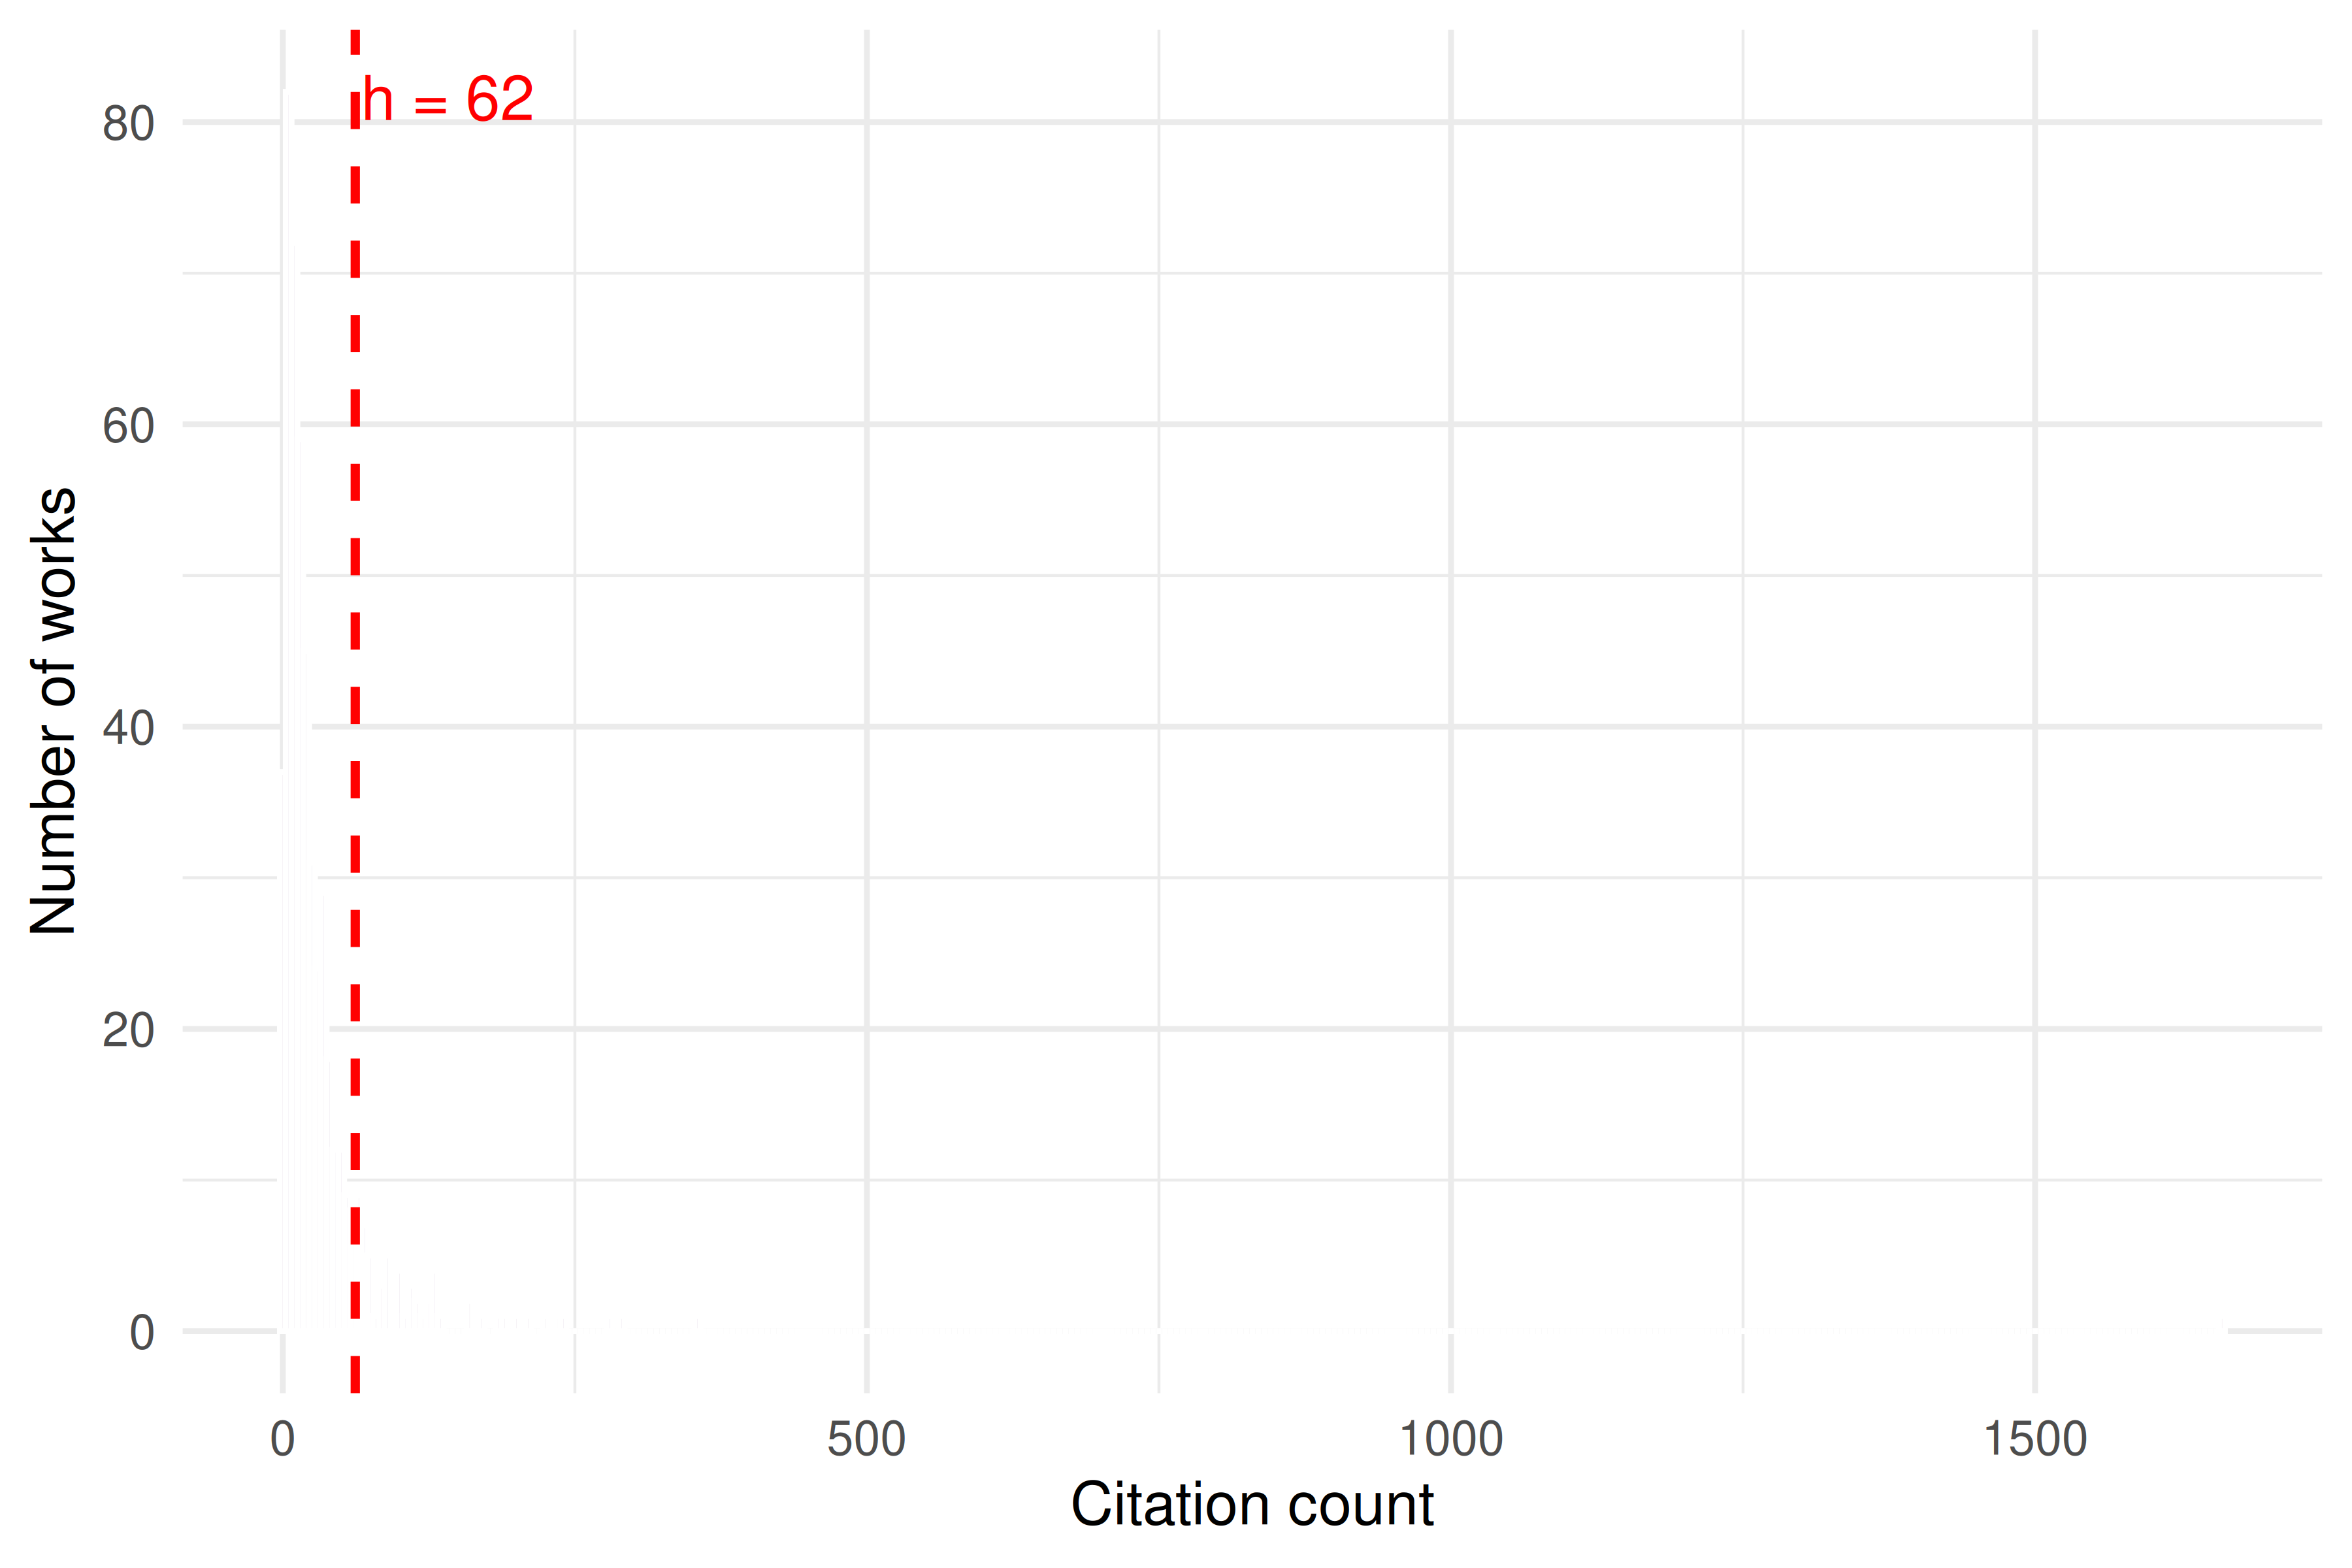
Figure 10.1: Citation distribution of sampled works, with the h-index threshold marked.
works_normalized |>
  group_by(year) |>
  summarise(sample_ratio = mean(ncs, na.rm = TRUE), .groups = "drop") |>
  ggplot(aes(x = year, y = sample_ratio)) +
  geom_line(color = palette_sci(1), linewidth = 1) +
  geom_point(color = palette_sci(1), size = 3) +
  geom_hline(yintercept = 1, linetype = "dashed", color = "grey50") +
  labs(x = "Publication year", y = "Within-sample/year ratio") +
  theme_sci()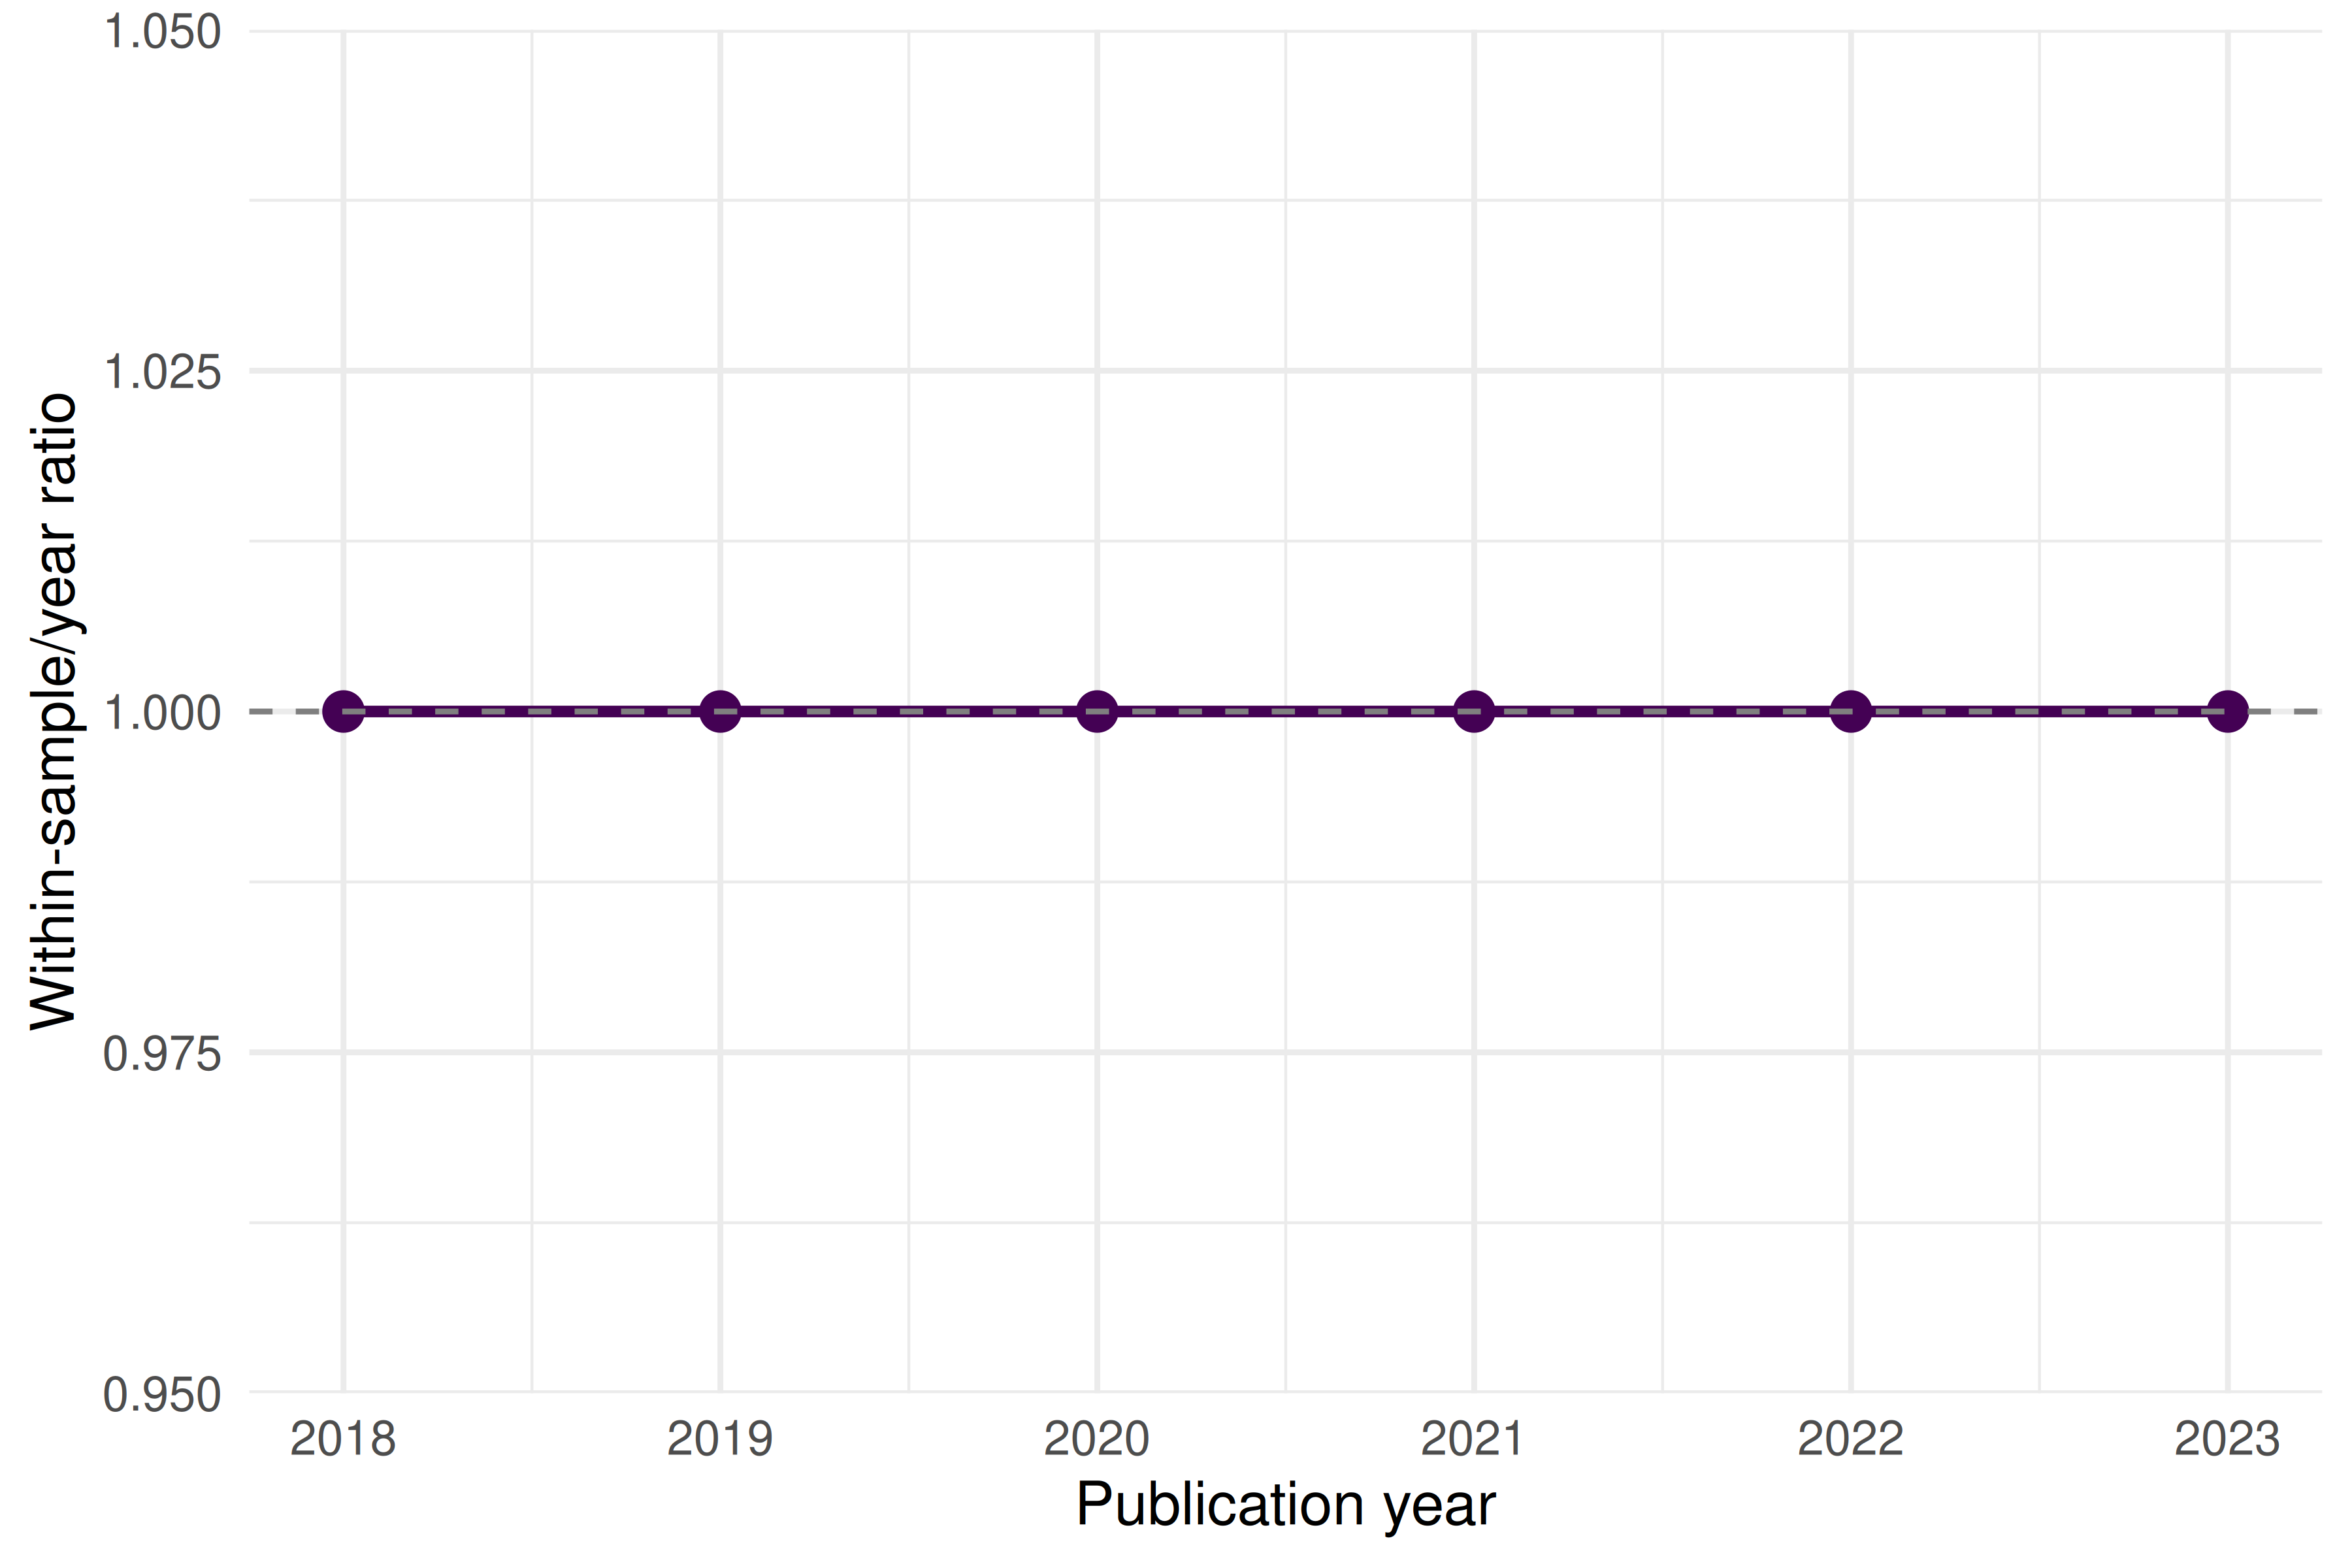
Figure 10.2: Diagnostic: each usable sample/year normalizes to its own mean of one.
10.4.8 Summary table
tibble(
  Indicator = c("Sample h-index", "Sample g-index", "Sample h/span", "Mean sample/year ratio", "Sample upper-percentile share"),
  Value = c(
    as.character(h),
    as.character(g),
    round(h_per_span, 3) |> as.character(),
    round(sample_ratio, 3) |> as.character(),
    scales::percent(pp_top10, accuracy = 0.1)
  ),
  Interpretation = c(
    glue("{h} papers with >= {h} citations each"),
    glue("Top {g} papers have >= {g}^2 = {g^2} cumulative citations"),
    "Not a career m-quotient",
    "One by construction; not MNCS",
    "Within-sample rank rule; not world PP(top 10%)"
  )
) |>
gt()| Indicator | Value | Interpretation |
|---|---|---|
| Sample h-index | 62 | 62 papers with >= 62 citations each |
| Sample g-index | 105 | Top 105 papers have >= 105^2 = 11025 cumulative citations |
| Sample h/span | 10.407 | Not a career m-quotient |
| Mean sample/year ratio | 1 | One by construction; not MNCS |
| Sample upper-percentile share | 10.8% | Within-sample rank rule; not world PP(top 10%) |
10.5 Diagnostics and interpretation
When interpreting bibliometric indicators, keep in mind:
- Citation windows matter. Recent papers have had less time to accumulate citations. The MNCS accounts for this by normalizing within publication year, but raw h-index and g-index do not.
- Field differences. A “good” h-index in mathematics differs vastly from one in biomedicine. Only compare within fields, or use field-normalized indicators.
- Size dependence. The h-index grows with the number of papers published. Comparing researchers at different career stages or with different publication rates requires the m-quotient or percentile indicators.
- Self-citations. None of the indicators above exclude self-citations. In a full analysis, consider computing variants with and without self-citations.
10.7 Limitations and responsible use
No single number can capture the quality, significance, or societal impact of a researcher’s work. The Leiden Manifesto (Hicks et al. 2015) offers ten principles for the responsible use of metrics:
- Quantitative evaluation should support, not replace, expert assessment.
- Measure performance against the research missions of the institution, group, or researcher.
- Protect excellence in locally relevant research (not just globally visible research).
- Keep data collection and analytical processes open, transparent, and simple.
- Allow those being evaluated to verify data and analysis.
The h-index in particular can be gamed through self-citation, salami slicing, or guest authorship. It penalises researchers in small fields, those who publish fewer but higher-impact works, and those who take career breaks. The DORA declaration (American Society for Cell Biology 2012) explicitly warns against using journal-level metrics (like the Impact Factor) as surrogates for individual article quality — but the same caution applies to any single indicator.
Always present multiple indicators alongside qualitative context. Never use a single number to make hiring, promotion, or funding decisions.
10.9 Common pitfalls
- Comparing h-indices across fields. A physicist with h = 40 and a mathematician with h = 15 may have equivalent standing in their respective fields. Use field-normalized indicators for cross-field comparisons.
- Ignoring the citation window. Computing MNCS without accounting for publication year conflates old, well-cited papers with recent ones that haven’t had time to accumulate citations.
- Using the wrong denominator for PP(top 10%). The “top 10%” must be defined relative to the same field and year, not relative to your own corpus.
- Reporting precision that isn’t there. An MNCS of 1.237 vs. 1.241 is not a meaningful difference. Report with appropriate precision and always provide confidence intervals or bootstrapped uncertainty where possible.
10.10 Exercises
Career h-index. Fetch all works by a specific author using
oa_fetch(entity = "works", author.id = "..."). Compute their h-index, g-index, and m-quotient. How do the three indicators tell different stories about the same career?Self-citation sensitivity. If you could identify self-citations (e.g., via author overlap in the reference list), how would removing them affect the h-index? Write pseudocode for this analysis.
Empirical resampling. Resample the within-sample/year ratios while holding their empirical reference fixed. Explain why the resulting interval does not measure uncertainty about world-normalized MNCS.
Normalization and ranks. Compare each year’s mean sample ratio with its upper-percentile share. Explain why the ratio is fixed at one and why ties can change the percentile share; neither ranks world-normalized impact.
10.11 Solutions
Solutions are provided in E.
10.12 Further reading
- Hirsch (2005) — The original h-index paper.
- Egghe (2006) — The g-index, addressing the h-index’s insensitivity to highly cited papers.
- Waltman (2016) — A comprehensive review of citation impact indicators and their properties.
- Waltman et al. (2011) — The theoretical basis for the MNCS (“new crown indicator”).
- Hicks et al. (2015) — The Leiden Manifesto: ten principles for responsible metrics.
- American Society for Cell Biology (2012) — DORA: the San Francisco Declaration on Research Assessment.
10.13 Session info
#> R version 4.6.1 (2026-06-24)
#> Platform: x86_64-pc-linux-gnu
#> Running under: Ubuntu 24.04.5 LTS
#>
#> Matrix products: default
#> BLAS:   /usr/lib/x86_64-linux-gnu/openblas-pthread/libblas.so.3
#> LAPACK: /usr/lib/x86_64-linux-gnu/openblas-pthread/libopenblasp-r0.3.26.so;  LAPACK version 3.12.0
#>
#> locale:
#>  [1] LC_CTYPE=C.UTF-8       LC_NUMERIC=C           LC_TIME=C.UTF-8
#>  [4] LC_COLLATE=C.UTF-8     LC_MONETARY=C.UTF-8    LC_MESSAGES=C.UTF-8
#>  [7] LC_PAPER=C.UTF-8       LC_NAME=C              LC_ADDRESS=C
#> [10] LC_TELEPHONE=C         LC_MEASUREMENT=C.UTF-8 LC_IDENTIFICATION=C
#>
#> time zone: UTC
#> tzcode source: system (glibc)
#>
#> attached base packages:
#> [1] stats     graphics  grDevices utils     datasets  methods   base
#>
#> other attached packages:
#>  [1] quanteda_4.5.1     pdftools_3.9.1     arrow_26.0.1.1     bibliometrix_5.5.0
#>  [5] RefManageR_1.4.0   bib2df_1.1.2.0     rcrossref_1.2.1    gt_1.4.0
#>  [9] tidytext_0.4.3     glue_1.8.1         openalexR_3.1.2    lubridate_1.9.5
#> [13] forcats_1.0.1      stringr_1.6.0      dplyr_1.2.1        purrr_1.2.2
#> [17] readr_2.2.0        tidyr_1.3.2        tibble_3.3.1       ggplot2_4.0.4
#> [21] tidyverse_2.0.0
#>
#> loaded via a namespace (and not attached):
#>   [1] gridExtra_2.3.1        httr2_1.3.0            readxl_1.6.0
#>   [4] rlang_1.3.0            magrittr_2.0.5         otel_0.3.0
#>   [7] compiler_4.6.1         vctrs_0.7.3            httpcode_0.3.0
#>  [10] pkgconfig_2.0.3        fastmap_1.2.0          labeling_0.4.3
#>  [13] ca_0.72                utf8_1.2.6             promises_1.5.0
#>  [16] rmarkdown_2.32         tzdb_0.5.0             bit_4.6.0
#>  [19] xfun_0.62              cachem_1.1.0           jsonlite_2.0.0
#>  [22] SnowballC_0.7.1        later_1.4.8            parallel_4.6.1
#>  [25] stopwords_2.3          R6_2.6.1               bslib_0.12.0
#>  [28] stringi_1.8.9          RColorBrewer_1.1-3     cellranger_1.1.0
#>  [31] jquerylib_0.1.4        assertthat_0.2.1       Rcpp_1.1.2
#>  [34] bookdown_0.48          knitr_1.52             triebeard_0.4.1
#>  [37] base64enc_0.1-6        rentrez_1.2.4          httpuv_1.6.17
#>  [40] Matrix_1.7-5           igraph_2.3.4           timechange_0.4.0
#>  [43] tidyselect_1.2.1       stringdist_0.9.17      pubmedR_1.1.0
#>  [46] rstudioapi_0.19.0      yaml_2.3.12            viridis_0.6.5
#>  [49] miniUI_0.1.2           humaniformat_0.6.0     curl_8.1.0
#>  [52] qpdf_1.4.1             lattice_0.22-9         plyr_1.8.9
#>  [55] shiny_1.15.0           withr_3.0.3            S7_1.0.0
#>  [58] askpass_1.2.1          evaluate_1.0.5         zip_3.0.2
#>  [61] xml2_1.6.0             shinycssloaders_1.1.0  pillar_1.11.1
#>  [64] janeaustenr_1.0.0      DT_0.34.0              plotly_4.12.1
#>  [67] generics_0.1.4         rprojroot_2.1.1        hms_1.1.4
#>  [70] scales_1.4.0           xtable_1.8-8           contentanalysis_1.1.1
#>  [73] tools_4.6.1            data.table_1.18.6.1    tokenizers_0.3.0
#>  [76] openxlsx_4.2.9         XML_3.99-0.25          fs_2.1.0
#>  [79] visNetwork_2.1.4       fastmatch_1.1-8        grid_4.6.1
#>  [82] bibtex_0.5.3           urltools_1.7.3.1       rscopus_0.9.0
#>  [85] dimensionsR_0.0.3      bibliometrixData_0.3.0 cli_3.6.6
#>  [88] viridisLite_0.4.3      downlit_0.4.5          gtable_0.3.6
#>  [91] sass_0.5.0             digest_0.6.39          ggrepel_0.9.8
#>  [94] crul_1.6.0             htmlwidgets_1.6.4      farver_2.1.2
#>  [97] memoise_2.0.1          htmltools_0.5.9        lifecycle_1.0.5
#> [100] httr_1.4.9             here_1.0.2             mime_0.13
#> [103] bit64_4.8.6