31 Patent–Paper Linkages
R. Heller · Date: 2026-05-09 · Last changed: 2026-10-31
31.1 Learning objectives
After completing this chapter, you will be able to:
- Explain the significance of patent–paper citations for understanding research impact
- Specify the paper and patent identifiers needed to establish an observed linkage
- Explore scholarly citation metadata without treating it as patent-citation evidence
- Discuss the limitations of patent citations as indicators of technological impact
- Distinguish between direct citation (paper cited in patent) and indirect influence
31.3 Conceptual background
When a patent examiner or inventor cites a scientific paper in a patent document, it creates an observable link between knowledge production (science) and knowledge application (technology). These patent–paper citations (also called non-patent literature or NPL citations) are one of the few quantitative measures of the science–technology interface.
Patent citations serve a legal function: they define the prior art against which the patent’s novelty is assessed. Not all patent–paper citations reflect genuine intellectual influence — some are added by examiners for legal completeness, not because the inventor actually used the cited research. Nevertheless, at the aggregate level, patent citation patterns reveal which fields, journals, and institutions produce research that feeds into technological innovation.
The biomedical and chemical sciences dominate patent–paper linkages because pharmaceutical and chemical patents routinely cite scientific literature. Physics and engineering have moderate linkages. Social sciences and humanities are rarely cited in patents, not because they lack impact, but because their impact operates through different channels (policy, education, culture).
The OpenAlex fields retrieved in this example describe scholarly works and scholarly citations. They contain no citing patent identifiers, patent citation dates, or patent-family identifiers. Establishing a patent–paper linkage requires a separate, documented source of patent references and a validated match to the cited paper. The analysis below does not perform that linkage.
31.4 Worked example
This executable example explores a 500-article scholarly-citation sample. It is preparation for a possible future linkage analysis, not a substitute for patent data. A high scholarly citation count does not identify a patent-cited paper. No patent-citation prevalence, rate, or technological impact is estimated here.
31.4.1 Preparing a scholarly-citation sample
works <- fetch_openalex(
  entity = "works",
  from_publication_date = "2015-01-01",
  to_publication_date = "2020-12-31",
  type = "article",
  options = list(sample = 500, seed = 42)
)

works_citations <- works |>
  transmute(
    id, display_name, source_display_name,
    year = year(publication_date),
    cited_by_count,
    referenced_works_count,
    type
  )

cat(glue("Total works: {nrow(works_citations)}\n"))
#> Total works: 50031.4.2 Scholarly citation distribution
p90 <- quantile(works_citations$cited_by_count, 0.90)

ggplot(works_citations, aes(x = cited_by_count)) +
  geom_histogram(binwidth = 10, fill = palette_sci(1), colour = "white") +
  geom_vline(xintercept = p90, linetype = "dashed", colour = "red") +
  annotate("text", x = p90 + 20, y = Inf, label = "90th percentile",
           vjust = 2, colour = "red", size = 3) +
  labs(x = "Scholarly citation count", y = "Papers") +
  theme_sci()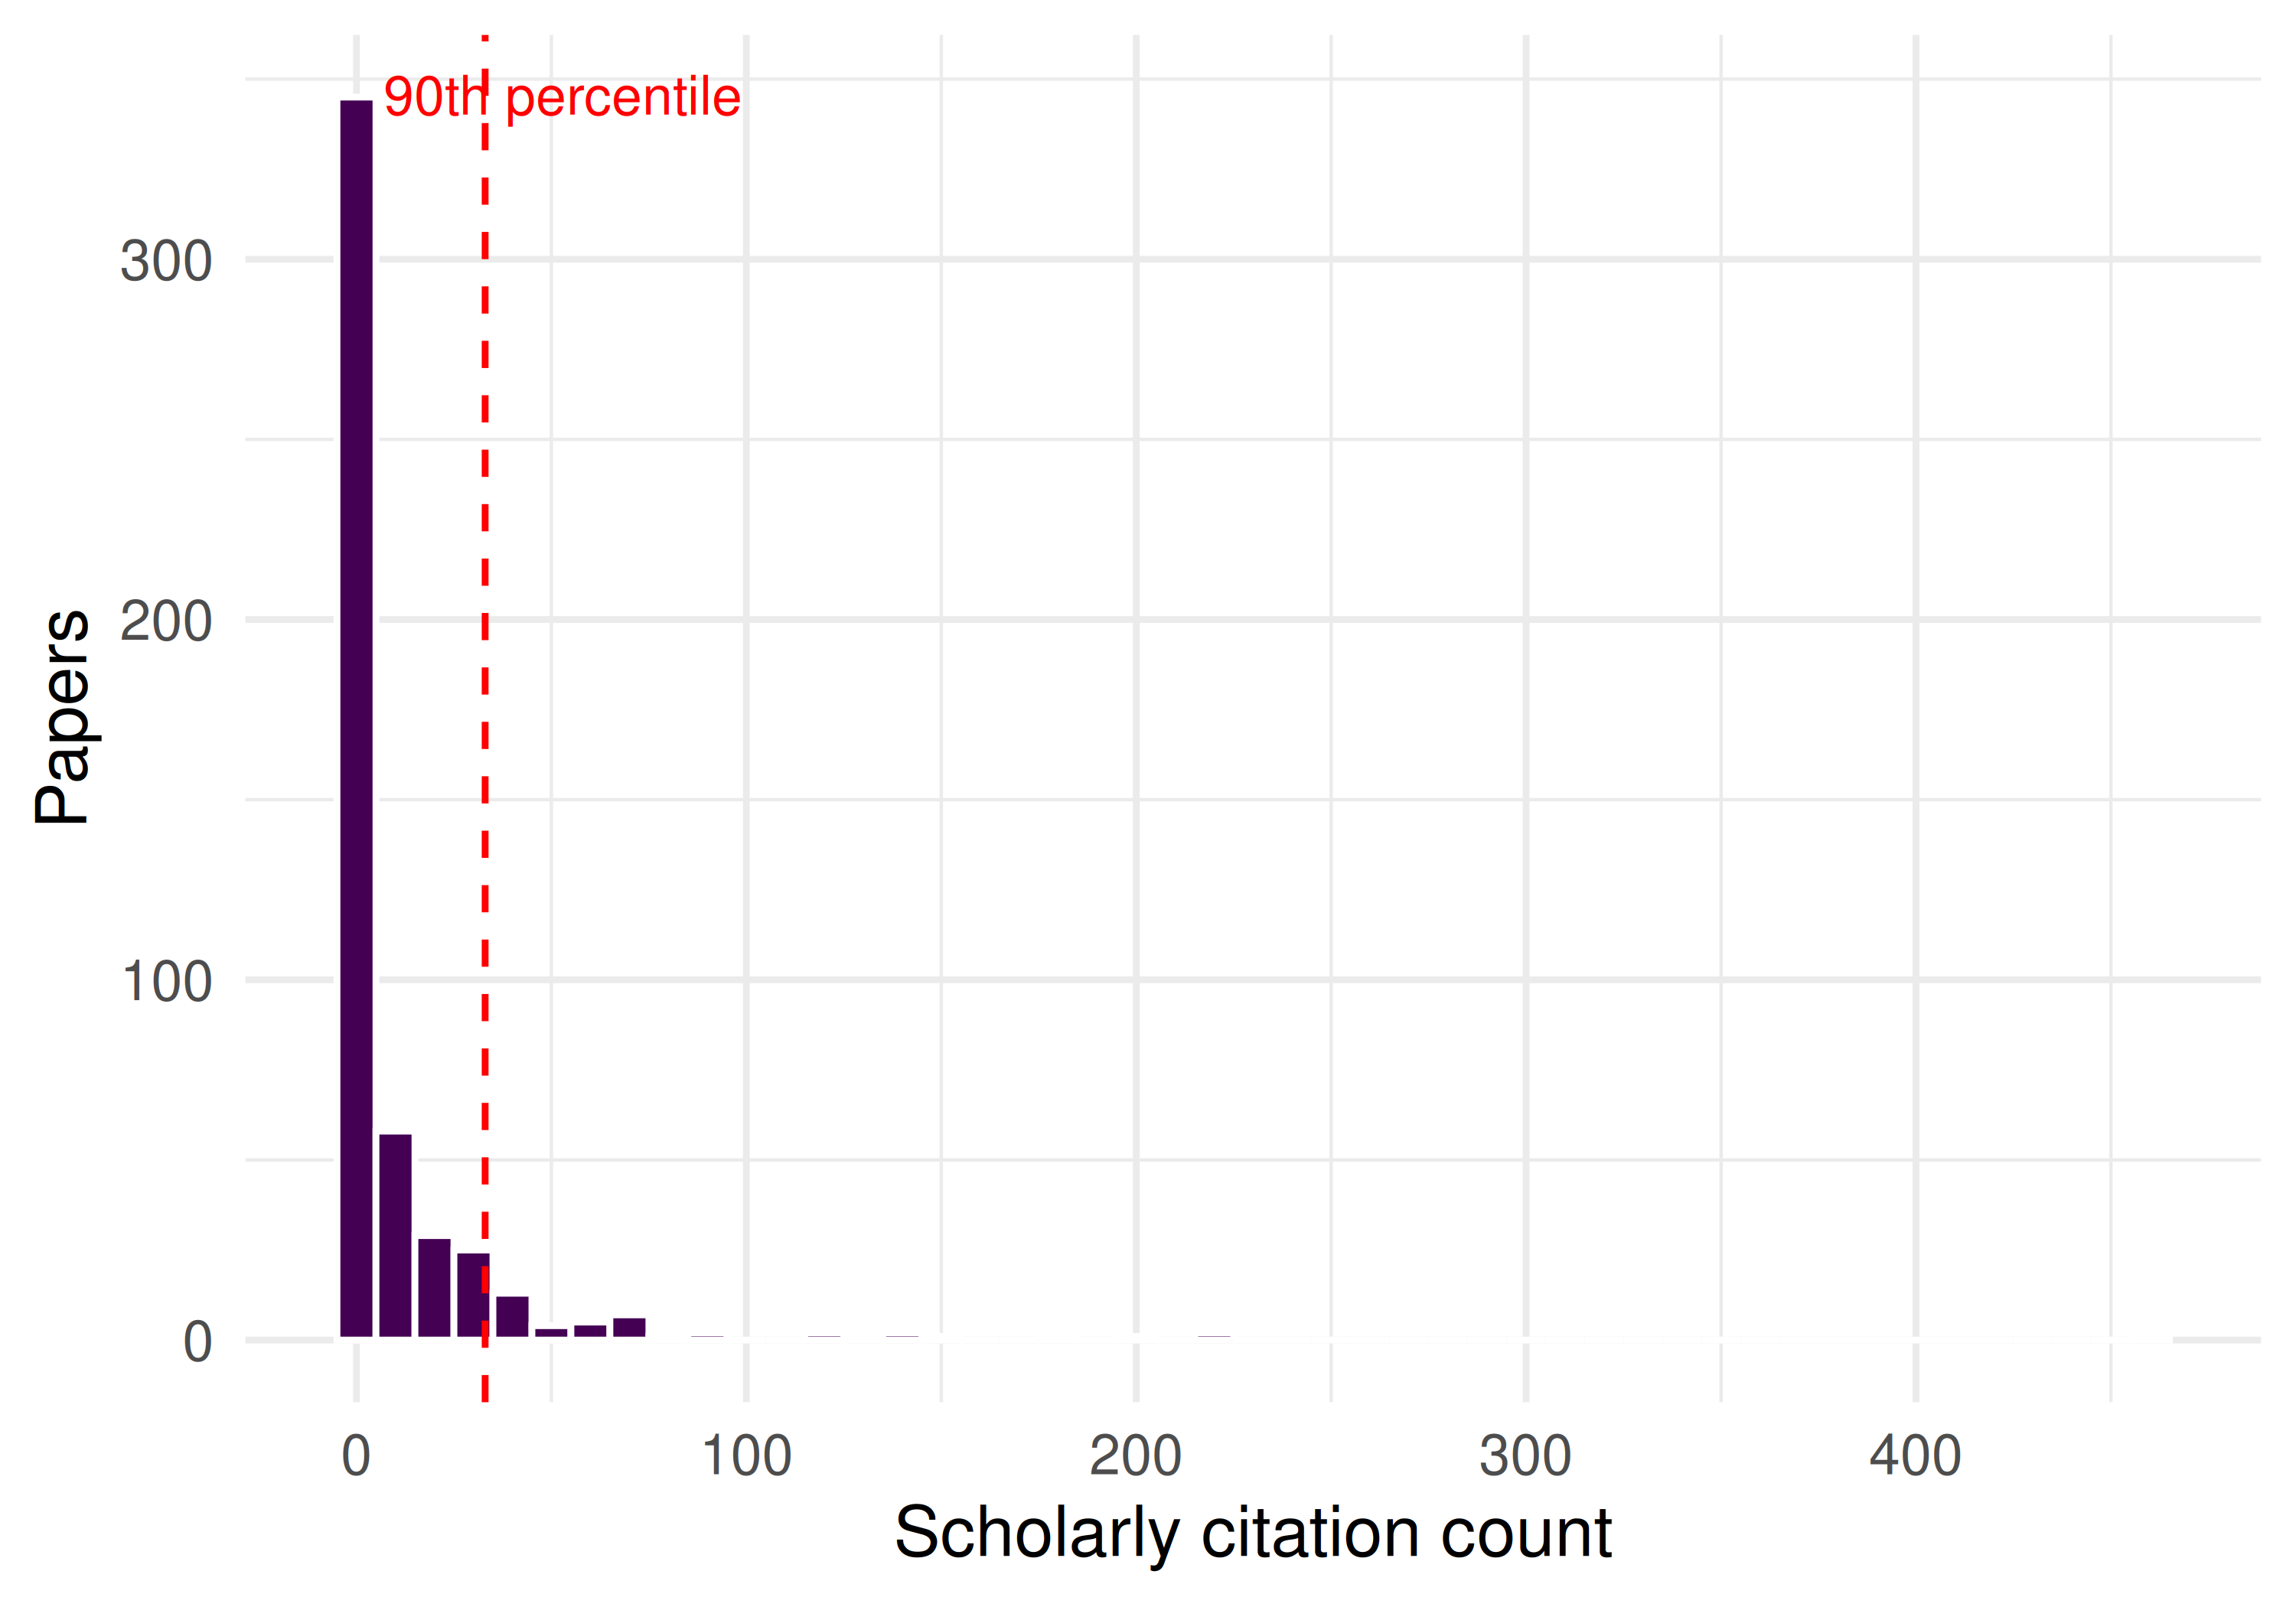
Figure 31.1: Scholarly citation counts in the sample, with the sample 90th percentile marked.
31.4.3 Journals represented among highly cited sampled papers
works_citations |>
  filter(cited_by_count >= p90, !is.na(source_display_name)) |>
  count(source_display_name, sort = TRUE) |>
  head(15) |>
  mutate(source_display_name = fct_reorder(source_display_name, n)) |>
  ggplot(aes(x = n, y = source_display_name)) +
  geom_col(fill = palette_sci(1)) +
  labs(x = "Highly cited sampled papers", y = NULL) +
  theme_sci()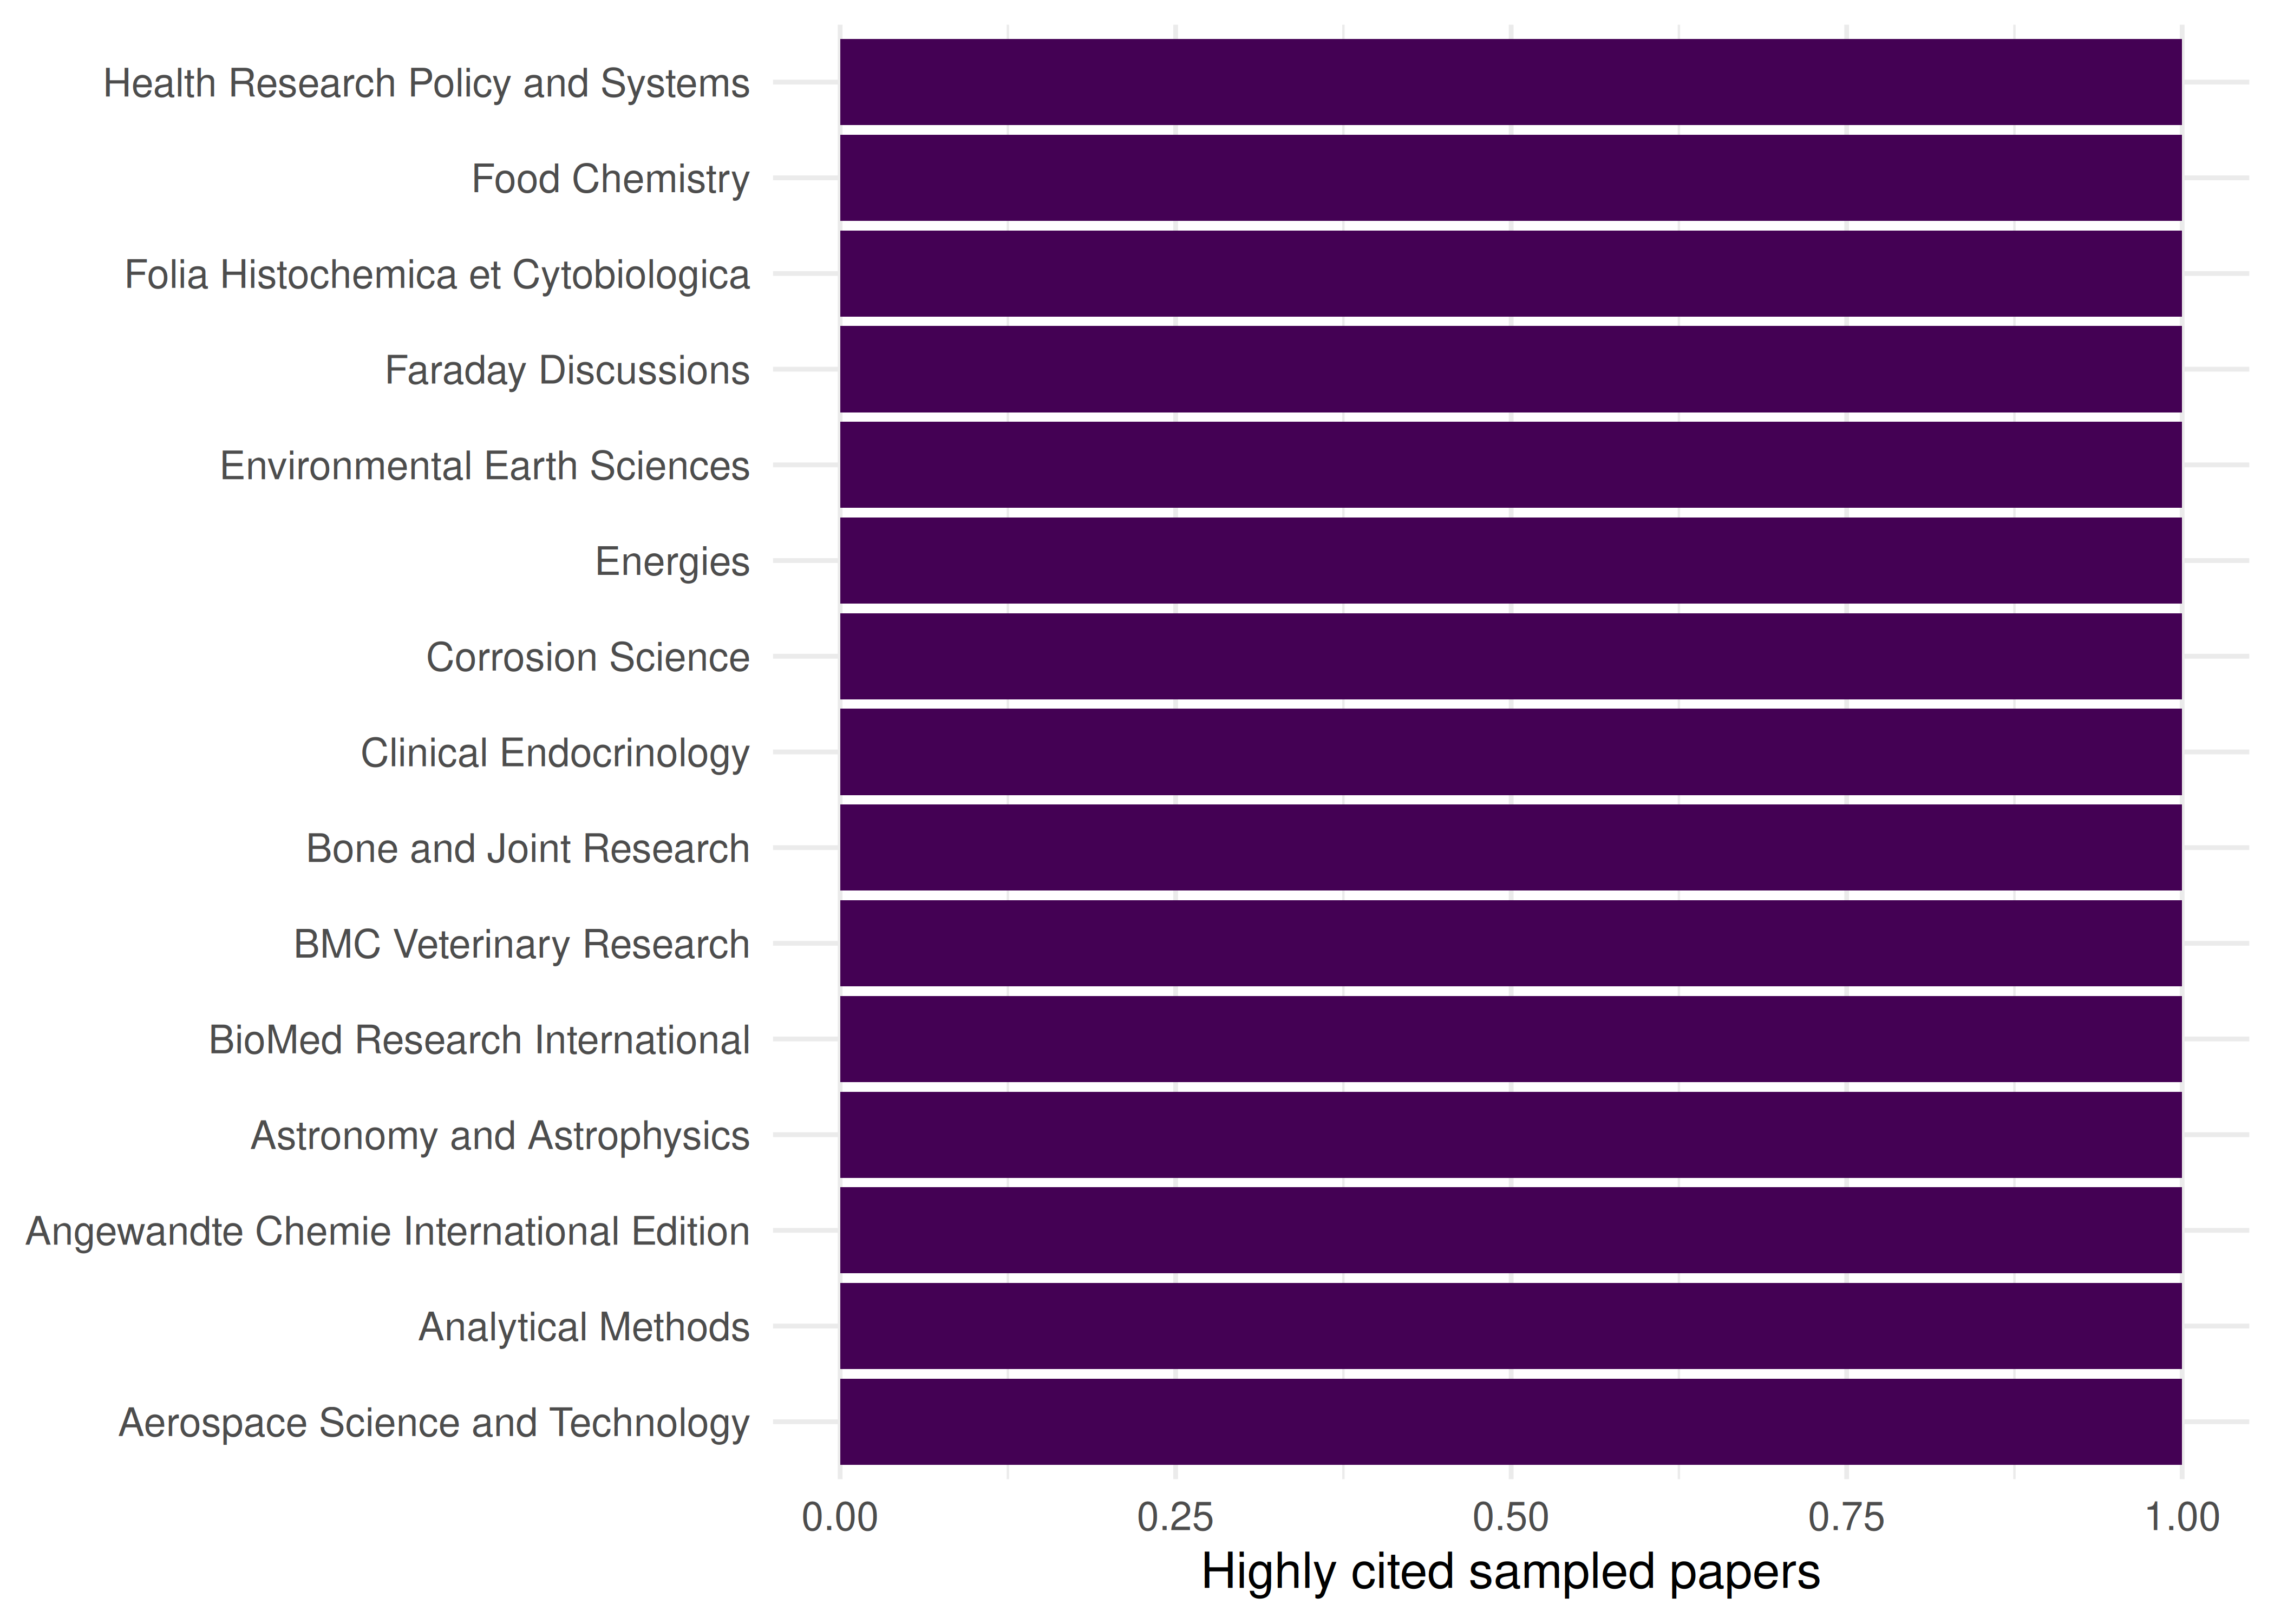
Figure 31.2: Up to 15 journals with the most sampled papers at or above the sample scholarly-citation 90th percentile.
31.4.4 Descriptive characteristics by scholarly-citation group
works_citations |>
  mutate(high_cite = cited_by_count >= p90) |>
  group_by(high_cite) |>
  summarise(
    n = n(),
    mean_refs = round(mean(referenced_works_count, na.rm = TRUE), 1),
    mean_year = round(mean(year), 1),
    .groups = "drop"
  ) |>
gt()| high_cite | n | mean_refs | mean_year |
|---|---|---|---|
| FALSE | 449 | 11.0 | 2017 |
| TRUE | 51 | 50.3 | 2017 |
31.5 Diagnostics and interpretation
-
Measured quantity:
cited_by_countin this analysis counts scholarly citations. Neither the threshold nor the journal plot measures patent citations. - Sample and threshold: Counts refer only to the retrieved sample, not total journal output. Ties at the 90th percentile can place more than 10% of papers in the high-citation group.
- Citation window: Current cumulative counts give older publication cohorts more time to receive citations. They are not a fixed-window impact measure.
- Field normalisation: Biomedical papers are far more likely to be cited in patents than social science papers. Compare patent citation rates within fields, not across them.
- Time lag: Estimating a paper-to-patent citation delay requires both dates from actual linked records and a stated observation cutoff; current scholarly citation counts cannot supply it.
- Examiner vs. inventor citations: Patent examiners add citations that inventors may not have used. This inflates apparent science–technology linkage.
31.7 Limitations and responsible use
- Patent citations are a narrow measure of impact. Much research influences technology without being cited in patents — through consulting, training, open-source software, or informal knowledge transfer.
- Field coverage differs. Patent citations capture only some forms of influence. Comparing fields without considering these differences can misrepresent their contributions (Hicks et al. 2015).
- Geographic bias. Patent systems vary by country. US and European patents have different citation practices. Analyses based on one patent office may not generalise.
- Not evaluative for individuals. A researcher whose paper is cited in a patent may have had no involvement with the technology. Patent citation reflects relevance of the knowledge, not the researcher’s intent to innovate.
31.9 Common pitfalls
- Equating patent citations with commercialisation. A patent citation means the paper is prior art, not that the research led to a product.
- Ignoring time lags. Comparing patent citation rates for papers published in 2023 vs. 2010 is meaningless — the 2023 papers have not had time to be cited in patents.
- Double-counting across patent families. The same invention may be patented in multiple countries. Count at the patent family level, not the individual patent level.
- Substituting scholarly citations for patent linkages. High scholarly citation counts do not establish that a paper was cited by a patent. Require an observed patent–paper reference before classifying a paper as patent-cited.
31.10 Exercises
Scholarly-citation comparison. Compare citation distributions in two journal samples, reporting sample sizes, field differences, publication years, retrieval date and threshold choice. Explain why the result does not estimate patent-citation potential.
Linkage data specification. Design a table containing a paper identifier, citing patent identifier, patent-family identifier, citation date, source and match status. Describe how you would verify ambiguous references and retain unmatched records. This exercise requires actual patent-reference data before any linkage rates can be calculated.
Institutional patent linkage. Given an independently validated patent–paper dataset, define the publication denominator, observation window and patent-family deduplication rule for two institutions. Report coverage and uncertainty. If those data are unavailable, identify the missing inputs rather than using scholarly citation percentiles as a proxy.
31.11 Solutions
Solutions are provided in E.
31.12 Further reading
- Narin et al. (1997) — Foundational analysis of the linkage between science and technology through patent citations.
- Hicks et al. (2015) — Responsible metrics: why patent citations should not be the sole indicator of research impact.
- Priem et al. (2022) — OpenAlex scholarly-work metadata; this example does not establish patent-citation coverage.
31.13 Session info
#> R version 4.6.1 (2026-06-24)
#> Platform: x86_64-pc-linux-gnu
#> Running under: Ubuntu 24.04.5 LTS
#>
#> Matrix products: default
#> BLAS:   /usr/lib/x86_64-linux-gnu/openblas-pthread/libblas.so.3
#> LAPACK: /usr/lib/x86_64-linux-gnu/openblas-pthread/libopenblasp-r0.3.26.so;  LAPACK version 3.12.0
#>
#> locale:
#>  [1] LC_CTYPE=C.UTF-8       LC_NUMERIC=C           LC_TIME=C.UTF-8
#>  [4] LC_COLLATE=C.UTF-8     LC_MONETARY=C.UTF-8    LC_MESSAGES=C.UTF-8
#>  [7] LC_PAPER=C.UTF-8       LC_NAME=C              LC_ADDRESS=C
#> [10] LC_TELEPHONE=C         LC_MEASUREMENT=C.UTF-8 LC_IDENTIFICATION=C
#>
#> time zone: UTC
#> tzcode source: system (glibc)
#>
#> attached base packages:
#> [1] stats     graphics  grDevices utils     datasets  methods   base
#>
#> other attached packages:
#>  [1] uwot_0.2.5                Matrix_1.7-5
#>  [3] word2vec_0.4.1            stm_1.3.10
#>  [5] topicmodels_0.2-17        quanteda.textstats_0.97.2
#>  [7] visNetwork_2.1.4          ggraph_2.2.2
#>  [9] tidygraph_1.3.1           igraph_2.3.4
#> [11] quanteda_4.5.1            pdftools_3.9.1
#> [13] arrow_26.0.1.1            bibliometrix_5.5.0
#> [15] RefManageR_1.4.0          bib2df_1.1.2.0
#> [17] rcrossref_1.2.1           gt_1.4.0
#> [19] tidytext_0.4.3            glue_1.8.1
#> [21] openalexR_3.1.2           lubridate_1.9.5
#> [23] forcats_1.0.1             stringr_1.6.0
#> [25] dplyr_1.2.1               purrr_1.2.2
#> [27] readr_2.2.0               tidyr_1.3.2
#> [29] tibble_3.3.1              ggplot2_4.0.4
#> [31] tidyverse_2.0.0
#>
#> loaded via a namespace (and not attached):
#>   [1] bibtex_0.5.3           RColorBrewer_1.1-3     rstudioapi_0.19.0
#>   [4] jsonlite_2.0.0         magrittr_2.0.5         modeltools_0.2-25
#>   [7] farver_2.1.2           rmarkdown_2.32         fs_2.1.0
#>  [10] vctrs_0.7.3            memoise_2.0.1          askpass_1.2.1
#>  [13] base64enc_0.1-6        htmltools_0.5.9        contentanalysis_1.1.1
#>  [16] curl_8.1.0             janeaustenr_1.0.0      cellranger_1.1.0
#>  [19] sass_0.5.0             bslib_0.12.0           htmlwidgets_1.6.4
#>  [22] tokenizers_0.3.0       plyr_1.8.9             httr2_1.3.0
#>  [25] plotly_4.12.1          cachem_1.1.0           dimensionsR_0.0.3
#>  [28] mime_0.13              lifecycle_1.0.5        pkgconfig_2.0.3
#>  [31] R6_2.6.1               fastmap_1.2.0          shiny_1.15.0
#>  [34] digest_0.6.39          patchwork_1.3.2        shinycssloaders_1.1.0
#>  [37] rprojroot_2.1.1        RSpectra_0.16-2        SnowballC_0.7.1
#>  [40] labeling_0.4.3         urltools_1.7.3.1       timechange_0.4.0
#>  [43] mgcv_1.9-4             polyclip_1.10-7        httr_1.4.9
#>  [46] compiler_4.6.1         here_1.0.2             bit64_4.8.6
#>  [49] withr_3.0.3            S7_1.0.0               viridis_0.6.5
#>  [52] ggforce_0.5.0          MASS_7.3-65            bibliometrixData_0.3.0
#>  [55] tools_4.6.1            otel_0.3.0             stopwords_2.3
#>  [58] zip_3.0.2              httpuv_1.6.17          rentrez_1.2.4
#>  [61] nlme_3.1-169           promises_1.5.0         grid_4.6.1
#>  [64] stringdist_0.9.17      reshape2_1.4.5         generics_0.1.4
#>  [67] gtable_0.3.6           tzdb_0.5.0             rscopus_0.9.0
#>  [70] ca_0.72                data.table_1.18.6.1    hms_1.1.4
#>  [73] xml2_1.6.0             utf8_1.2.6             ggrepel_0.9.8
#>  [76] pillar_1.11.1          nsyllable_1.0.1        vroom_1.7.1
#>  [79] later_1.4.8            splines_4.6.1          tweenr_2.0.3
#>  [82] lattice_0.22-9         FNN_1.1.4.1            bit_4.6.0
#>  [85] tidyselect_1.2.1       tm_0.7-20              miniUI_0.1.2
#>  [88] downlit_0.4.5          knitr_1.52             gridExtra_2.3.1
#>  [91] NLP_0.3-3              bookdown_0.48          stats4_4.6.1
#>  [94] crul_1.6.0             xfun_0.62              graphlayouts_1.2.5
#>  [97] matrixStats_1.5.0      DT_0.34.0              humaniformat_0.6.0
#> [100] stringi_1.8.9          qpdf_1.4.1             yaml_2.3.12
#> [103] evaluate_1.0.5         httpcode_0.3.0         cli_3.6.6
#> [106] xtable_1.8-8           jquerylib_0.1.4        Rcpp_1.1.2
#> [109] readxl_1.6.0           triebeard_0.4.1        XML_3.99-0.25
#> [112] parallel_4.6.1         assertthat_0.2.1       pubmedR_1.1.0
#> [115] slam_0.1-56            viridisLite_0.4.3      scales_1.4.0
#> [118] crayon_1.5.3           openxlsx_4.2.9         rlang_1.3.0
#> [121] fastmatch_1.1-8