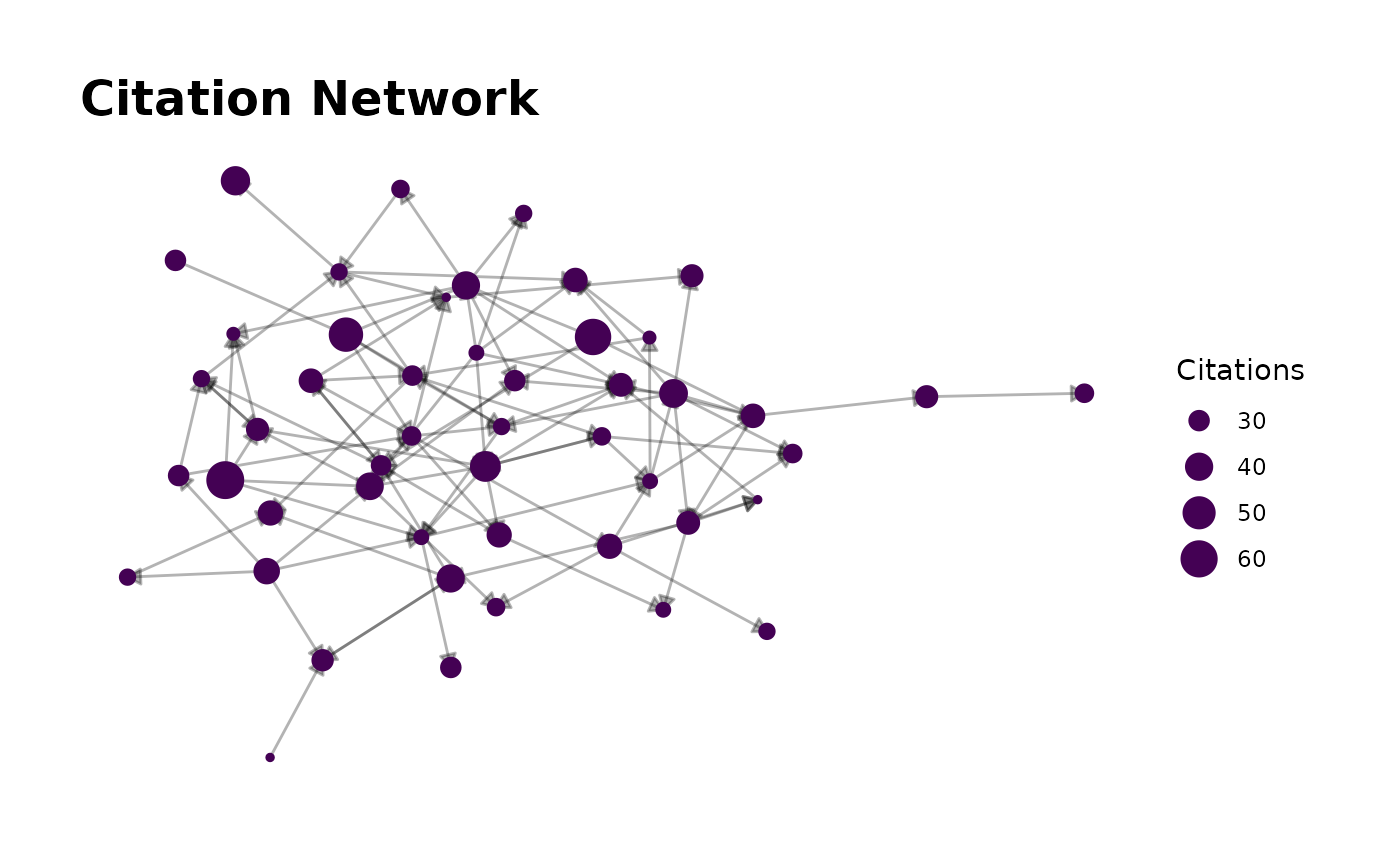
Visualise the citation network of top-cited works.
Usage
sm_plot_citation_network(
  corpus,
  top_n = 50L,
  dark = FALSE,
  precompute = FALSE,
  max_nodes = NULL,
  ...
)
Arguments
- corpus
An
sm_corpus.- top_n
Number of top works to include.
- dark
Logical; dark mode?
- precompute
Logical (default
FALSE). WhenTRUE, the graph layout is computed eagerly and a plain self-containedggplot(materialised coordinates) is returned, instead of a lazyggraphobject. Use this when embedding the plot in an RMarkdown/knitr/callr/workflowr document: the heavy layout runs once here rather than in the (often memory-limited) render subprocess, where largeggraphobjects can crash the harness.- max_nodes
Optional integer node cap.
NULL(default) keeps all nodes so existing renders are unchanged; set it to downsample large graphs to the highest-degree nodes (opt-in, with aclimessage).- ...
Additional arguments.
Value
A ggplot object (a ggraph plot when precompute = FALSE, a plain
ggplot when precompute = TRUE).
Large graphs
For big networks, prefer precompute = TRUE and save the returned object
(e.g. with saveRDS()); printing it in a document then re-renders cheaply
without recomputing the layout. See the networks section of the getting-
started vignette.
Examples
corpus <- sm_example_corpus()
sm_plot_citation_network(corpus)