Bar chart of publication counts over time.
Usage
sm_plot_production(corpus, by = c("year", "month"), dark = FALSE, ...)Examples
corpus <- sm_example_corpus()
sm_plot_production(corpus)
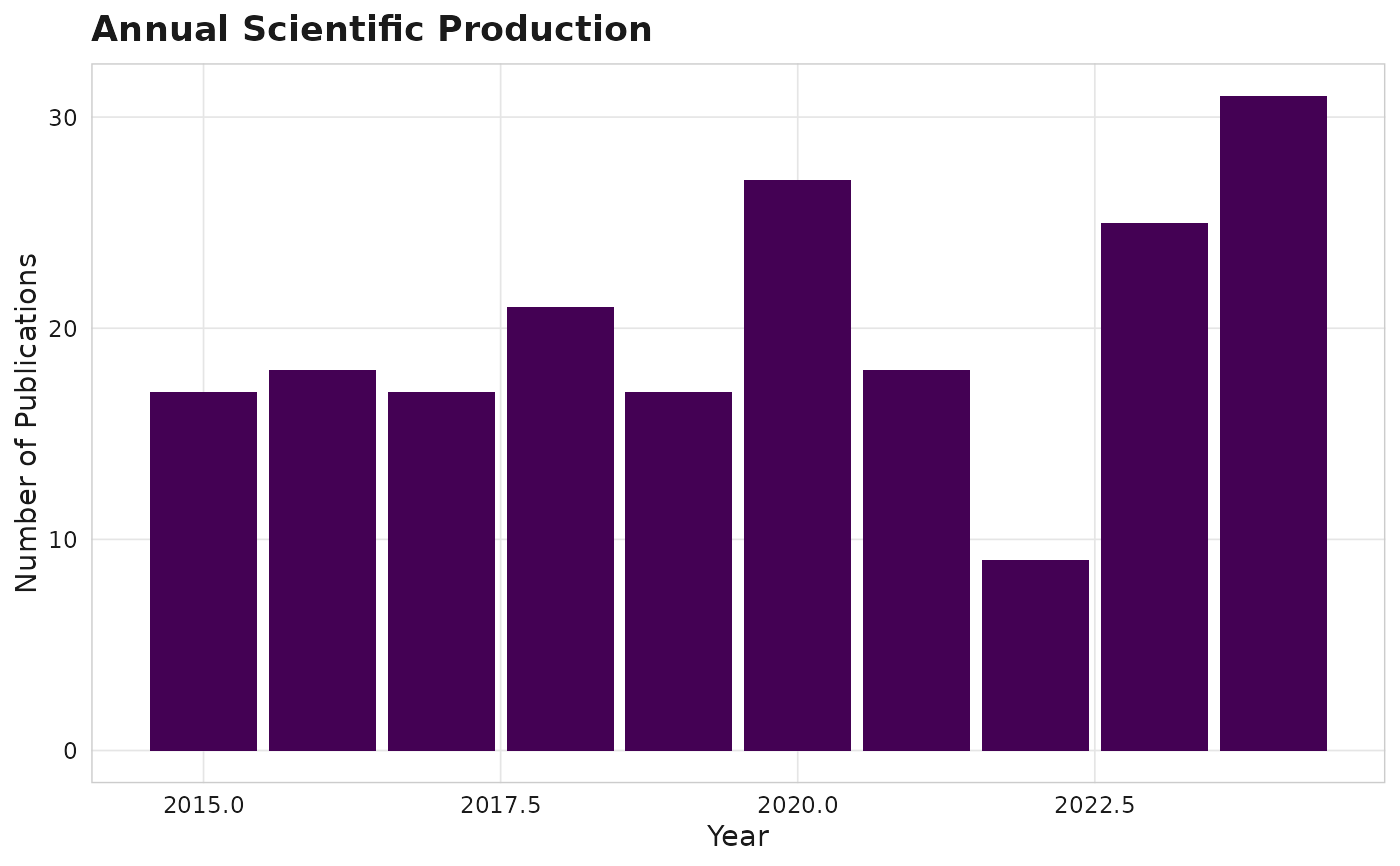
Bar chart of publication counts over time.
sm_plot_production(corpus, by = c("year", "month"), dark = FALSE, ...)corpus <- sm_example_corpus()
sm_plot_production(corpus)