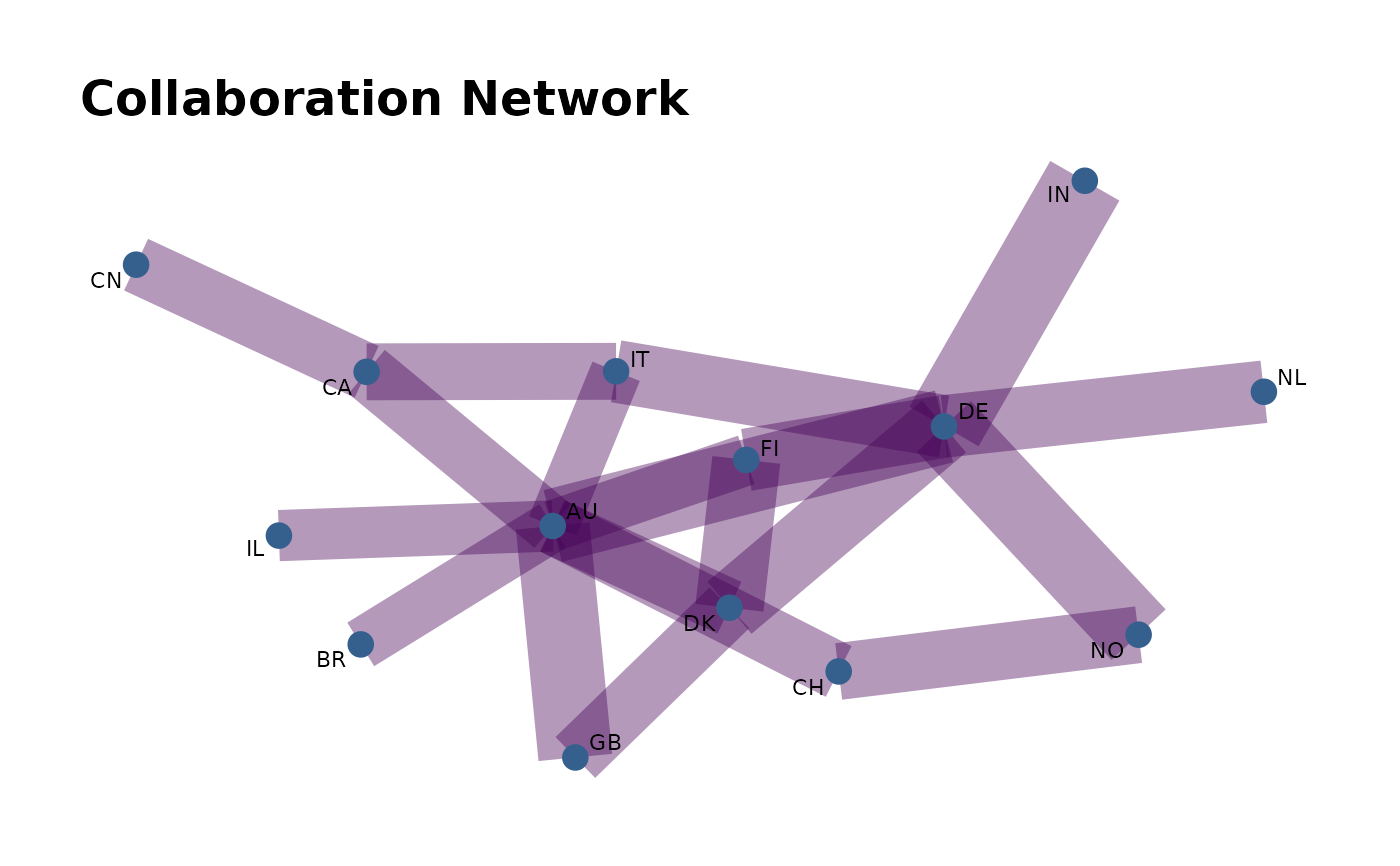
Visualise international or institutional collaboration patterns.
Usage
sm_plot_collab(
  corpus,
  level = c("country", "institution", "author"),
  top_n = 20L,
  dark = FALSE,
  precompute = FALSE,
  max_nodes = NULL,
  ...
)
Arguments
- corpus
An
sm_corpus.- level
Collaboration level.
- top_n
Number of top entities to include.
- dark
Logical; dark mode?
- precompute
Logical (default
FALSE). WhenTRUE, return a plainggplotwith the layout computed eagerly (seesm_plot_citation_network()for why this matters when knitting large graphs).- max_nodes
Optional integer node cap.
NULL(default) keeps all nodes; set it to downsample large graphs to the highest-degree nodes (opt-in, with aclimessage).- ...
Additional arguments.
See also
Other plots:
autoplot.sm_corpus(),
sm_palette_qualitative(),
sm_plot_bradford(),
sm_plot_citation_network(),
sm_plot_equity_dashboard(),
sm_plot_evolution(),
sm_plot_heaps(),
sm_plot_landscape(),
sm_plot_lotka(),
sm_plot_production(),
sm_plot_thematic_map(),
sm_plot_top(),
sm_scale_color(),
sm_theme()
Examples
corpus <- sm_example_corpus()
sm_plot_collab(corpus, level = "country")