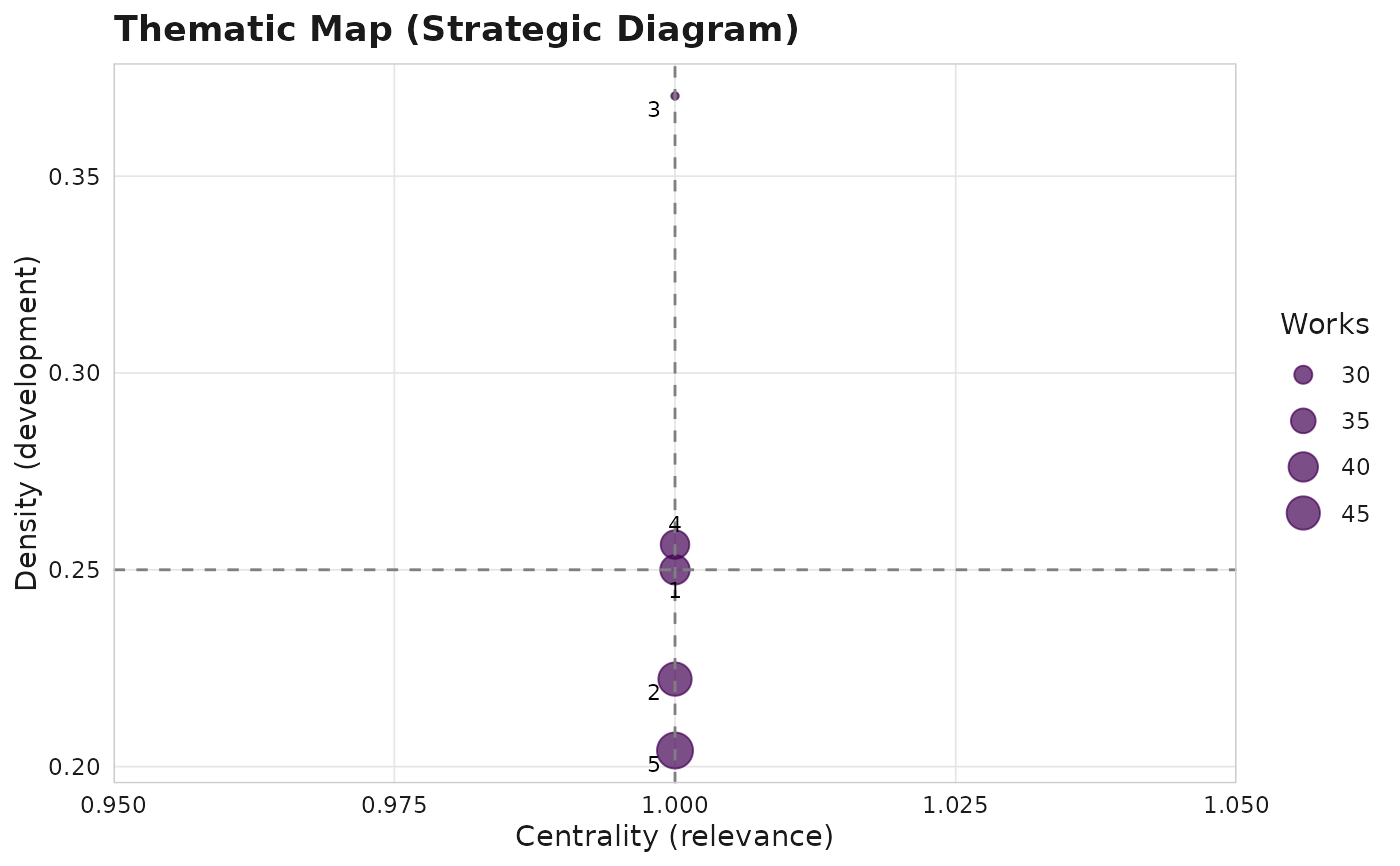
Strategic diagram plotting clusters by centrality (external links) and
density (internal links), following Callon et al.
Usage
sm_plot_thematic_map(corpus, by = "cluster_id", dark = FALSE, ...)
Arguments
- corpus
An sm_corpus with clusters.
- by
Grouping variable. Default "cluster_id".
- dark
Logical; dark mode?
- ...
Additional arguments.
See also
Other plots:
autoplot.sm_corpus(),
sm_palette_qualitative(),
sm_plot_bradford(),
sm_plot_citation_network(),
sm_plot_collab(),
sm_plot_equity_dashboard(),
sm_plot_evolution(),
sm_plot_heaps(),
sm_plot_landscape(),
sm_plot_lotka(),
sm_plot_production(),
sm_plot_top(),
sm_scale_color(),
sm_theme()
Examples
corpus <- sm_example_corpus(with_embeddings = TRUE, seed = 42)
corpus <- sm_cluster_hdbscan(corpus, min_cluster_size = 10)
#> ✔ HDBSCAN clustering complete.
#> ℹ 5 clusters found, 0 noise points.
sm_plot_thematic_map(corpus)