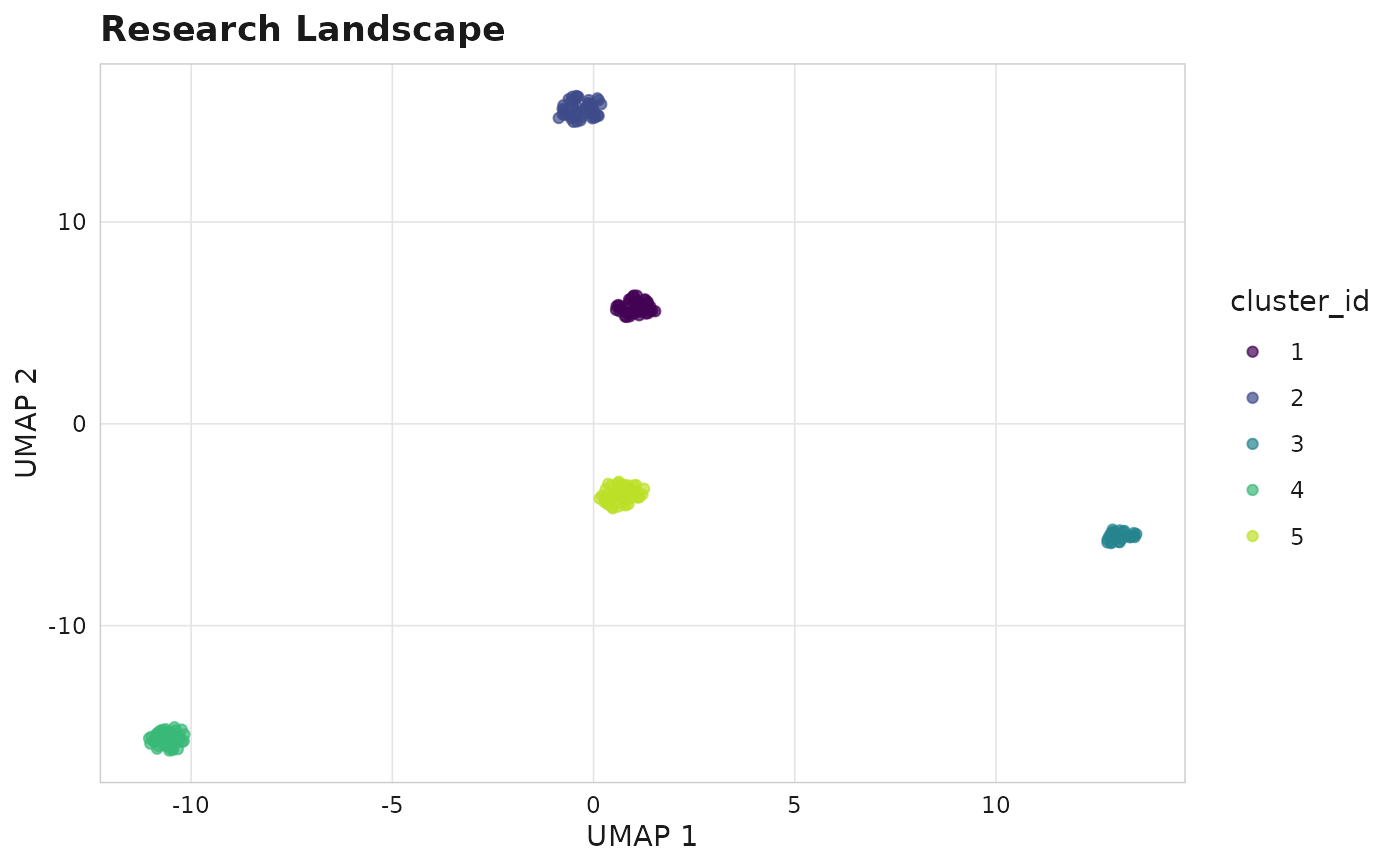
UMAP/t-SNE/PCA scatter plot of work embeddings, coloured by cluster.
Usage
sm_plot_landscape(
  corpus,
  color_by = "cluster_id",
  reducer = c("umap", "tsne", "pca"),
  n_components = 2L,
  dark = FALSE,
  ...
)
Arguments
- corpus
An sm_corpus with embeddings.
- color_by
Column name in works to colour by. Default "cluster_id".
- reducer
Dimensionality reduction method.
- n_components
Number of output dimensions (2 for plotting).
- dark
Logical; dark mode?
- ...
Additional arguments.
See also
Other plots:
autoplot.sm_corpus(),
sm_palette_qualitative(),
sm_plot_bradford(),
sm_plot_citation_network(),
sm_plot_collab(),
sm_plot_equity_dashboard(),
sm_plot_evolution(),
sm_plot_heaps(),
sm_plot_lotka(),
sm_plot_production(),
sm_plot_thematic_map(),
sm_plot_top(),
sm_scale_color(),
sm_theme()
Examples
corpus <- sm_example_corpus()
corpus <- sm_cluster_hdbscan(corpus, min_cluster_size = 10)
#> ✔ HDBSCAN clustering complete.
#> ℹ 5 clusters found, 0 noise points.
sm_plot_landscape(corpus)