Wraps viridis with sensible defaults for scimapR plots.
Usage
sm_scale_color(option = "viridis", discrete = TRUE, ...)

sm_scale_fill(option = "viridis", discrete = TRUE, ...)See also
Other plots:
autoplot.sm_corpus(),
sm_palette_qualitative(),
sm_plot_bradford(),
sm_plot_citation_network(),
sm_plot_collab(),
sm_plot_equity_dashboard(),
sm_plot_evolution(),
sm_plot_heaps(),
sm_plot_landscape(),
sm_plot_lotka(),
sm_plot_production(),
sm_plot_thematic_map(),
sm_plot_top(),
sm_theme()
Examples
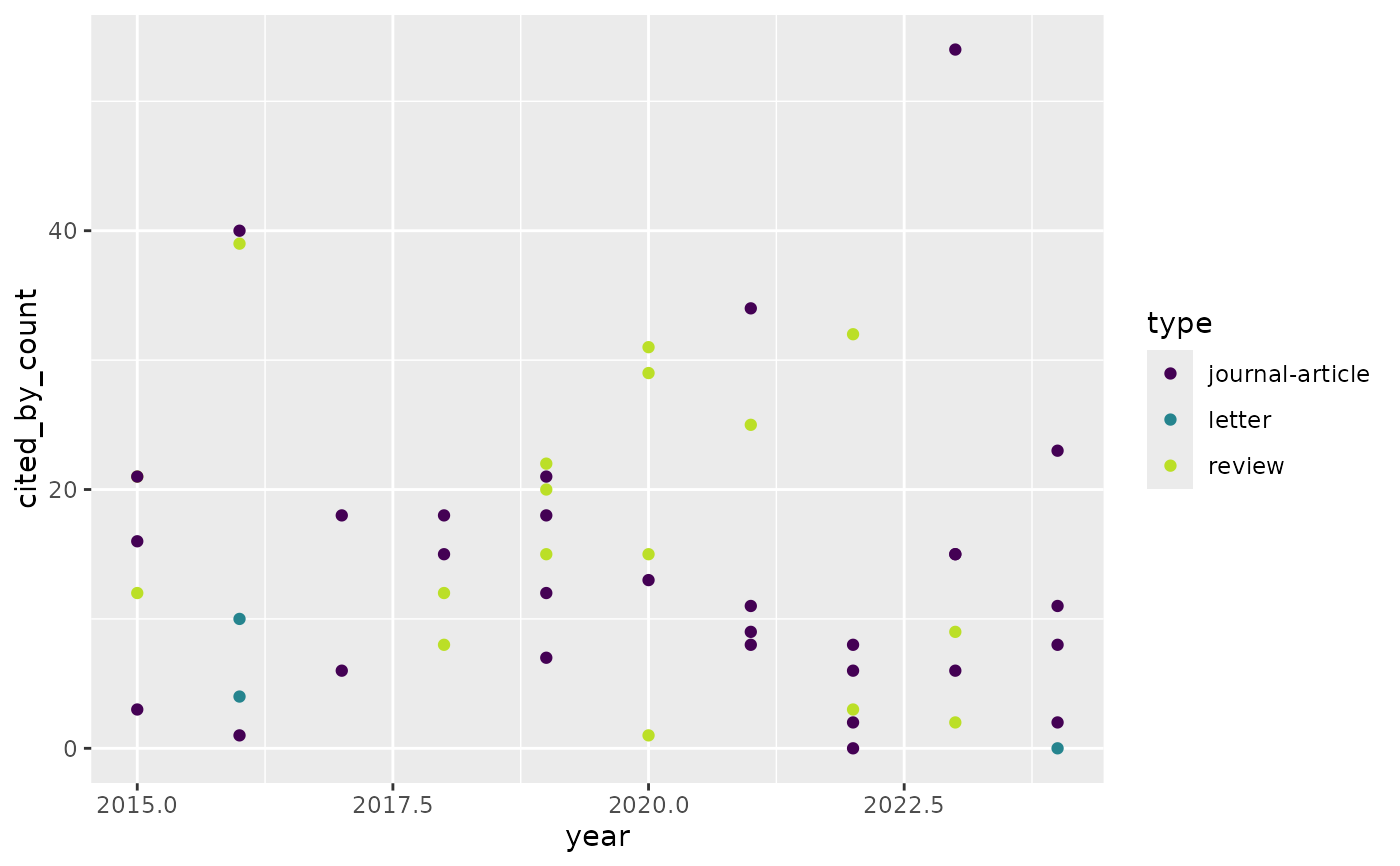
corpus <- sm_example_corpus(n_works = 50)
ggplot2::ggplot(corpus$works,
ggplot2::aes(year, cited_by_count, colour = type)) +
ggplot2::geom_point() +
sm_scale_color()
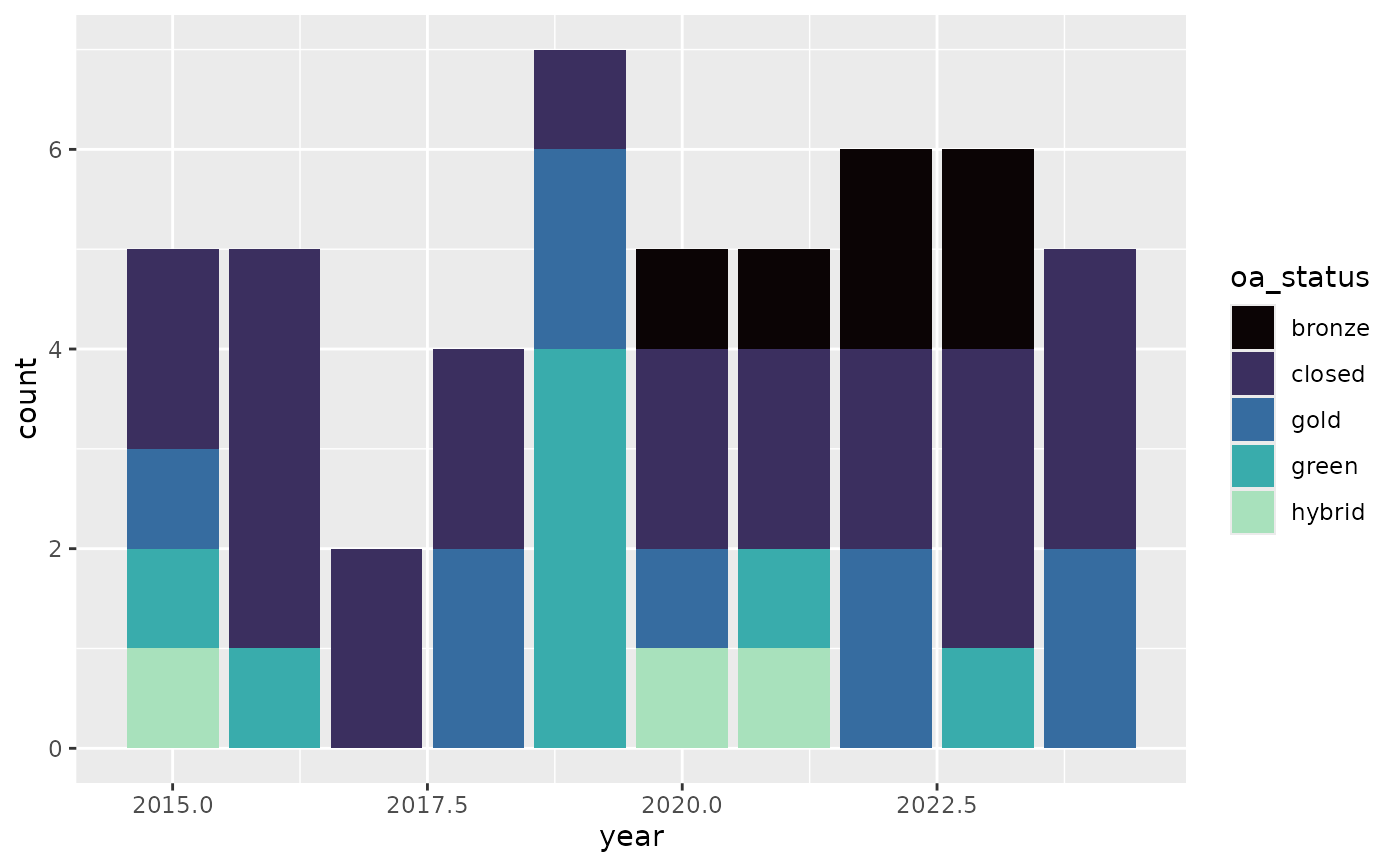
 ggplot2::ggplot(corpus$works, ggplot2::aes(year, fill = oa_status)) +
ggplot2::geom_bar() +
sm_scale_fill(option = "mako")