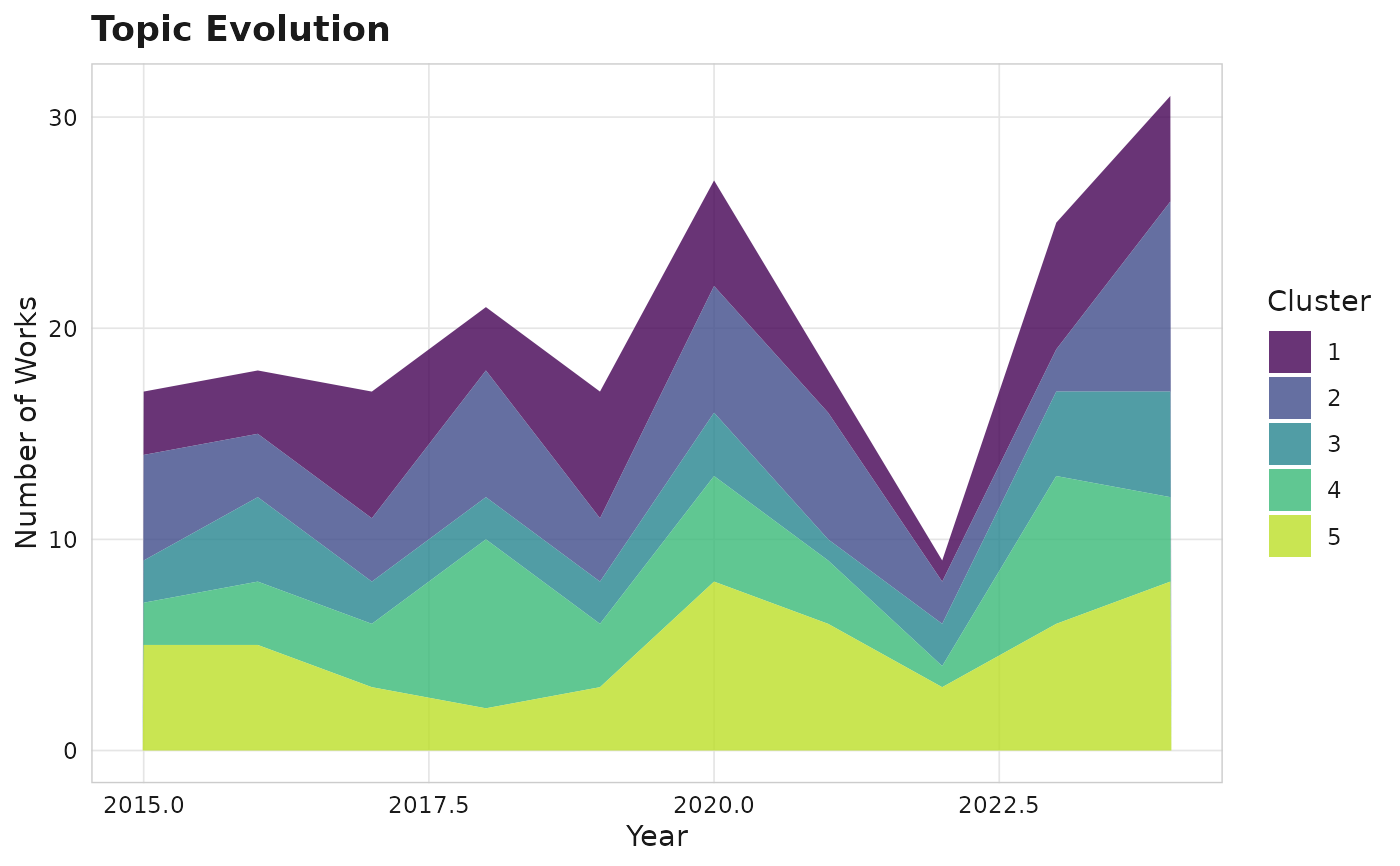
Visualise how research topics/clusters evolve across time periods.
Usage
sm_plot_evolution(corpus, time_var = "year", dark = FALSE, ...)
Arguments
- corpus
An sm_corpus with clusters and years.
- time_var
Column name for time variable. Default "year".
- dark
Logical; dark mode?
- ...
Additional arguments.
See also
Other plots:
autoplot.sm_corpus(),
sm_palette_qualitative(),
sm_plot_bradford(),
sm_plot_citation_network(),
sm_plot_collab(),
sm_plot_equity_dashboard(),
sm_plot_heaps(),
sm_plot_landscape(),
sm_plot_lotka(),
sm_plot_production(),
sm_plot_thematic_map(),
sm_plot_top(),
sm_scale_color(),
sm_theme()
Examples
# \donttest{
corpus <- sm_example_corpus(with_embeddings = TRUE, seed = 42)
corpus <- sm_cluster_hdbscan(corpus, min_cluster_size = 10)
#> ✔ HDBSCAN clustering complete.
#> ℹ 5 clusters found, 0 noise points.
sm_plot_evolution(corpus)

# }
# }