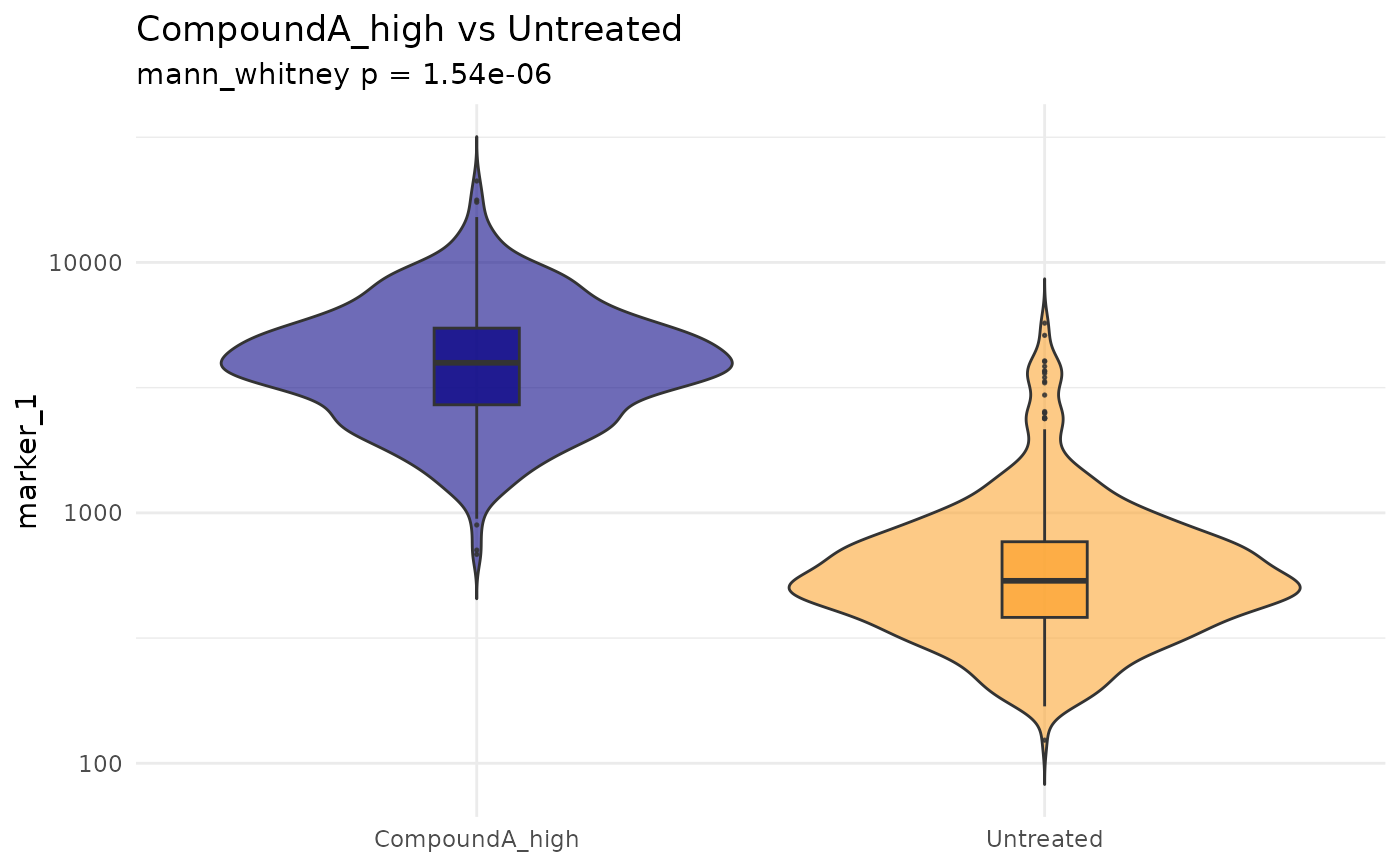
Comparison panel (box, fold change, p-value) for a single result
Source:R/plots-results.R
cr_plot_comparison.RdComparison panel (box, fold change, p-value) for a single result
Examples
exp <- cr_example_experiment(seed = 1, n_cells_per_well = 30)
res <- cr_test(exp, "marker_1", "CompoundA_high", "Untreated",
               test = "mann_whitney", level = "replicate")
cr_plot_comparison(res, exp)